Bank of America 2008 Annual Report Download - page 67
Download and view the complete annual report
Please find page 67 of the 2008 Bank of America annual report below. You can navigate through the pages in the report by either clicking on the pages listed below, or by using the keyword search tool below to find specific information within the annual report.-
 1
1 -
2
-
3
-
4
-
5
-
6
-
7
-
8
-
9
-
10
-
11
-
12
-
13
-
14
-
15
-
16
-
17
-
18
-
19
-
20
-
21
-
22
-
23
-
24
-
25
-
26
-
27
-
28
-
29
-
30
-
31
-
32
-
33
-
34
-
35
-
36
-
37
-
38
-
39
-
40
-
41
-
42
-
43
-
44
-
45
-
46
-
47
-
48
-
49
-
50
-
51
-
52
-
53
-
54
-
55
-
56
-
 57
57 -
 58
58 -
 59
59 -
 60
60 -
 61
61 -
 62
62 -
 63
63 -
 64
64 -
 65
65 -
 66
66 -
 67
67 -
 68
68 -
 69
69 -
 70
70 -
 71
71 -
 72
72 -
 73
73 -
 74
74 -
 75
75 -
 76
76 -
 77
77 -
78
-
79
-
80
-
81
-
82
-
83
-
84
-
85
-
86
-
87
-
88
-
89
-
90
-
91
-
92
-
93
-
94
-
95
-
96
-
97
-
98
-
99
-
100
-
101
-
102
-
103
-
104
-
105
-
106
-
107
-
108
-
109
-
110
-
111
-
112
-
113
-
114
-
115
-
116
-
117
-
118
-
119
-
120
-
121
-
122
-
123
-
124
-
125
-
126
-
127
-
128
-
129
-
130
-
131
-
132
-
133
-
134
-
135
-
136
-
137
-
138
-
139
-
140
-
141
-
142
-
143
-
144
-
145
-
146
-
147
-
148
-
149
-
150
-
151
-
152
-
153
-
154
-
155
-
156
-
157
-
158
-
159
-
160
-
161
-
162
-
163
-
164
-
165
-
166
-
167
-
168
-
169
-
170
-
171
-
172
-
173
-
174
-
175
-
176
-
177
-
178
-
179
-
180
-
181
-
182
-
183
-
184
-
185
-
186
-
187
-
188
-
189
-
190
-
191
-
192
-
193
-
194
-
195
 |
 |

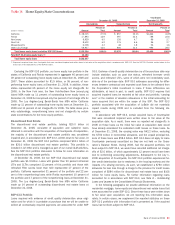
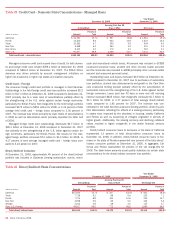
Table 18 Home Equity State Concentrations
December 31, 2008
Year Ended
December 31, 2008
Outstandings Nonperforming Net Charge-offs
(Dollars in millions) Amount
Percent of
Total Amount
Percent of
Total Amount
Percent of
Total
California $ 38,015 27.5% $ 857 32.1% $1,464 41.9%
Florida 17,893 12.9 597 22.4 788 22.6
New Jersey 8,929 6.5 126 4.7 96 2.7
New York 8,602 6.2 176 6.6 96 2.7
Massachusetts 6,008 4.3 48 1.8 56 1.6
Other U.S./Foreign 58,937 42.6 866 32.4 996 28.5
Total home equity loans (excluding SOP 03-3 loans)
$138,384 100.0% $2,670 100.0% $3,496 100.0%
Total SOP 03-3 home equity loans (1)
14,163
Total home equity loans
$152,547
(1) Represents acquired loans from Countrywide that were considered impaired and written down to fair value at the acquisition date in accordance with SOP 03-3. See the SOP 03-3 Portfolio section below for the
discussion of the characteristics of the SOP 03-3 loans.
Excluding the SOP 03-3 portfolio, our home equity loan portfolio in the
states of California and Florida represented in aggregate 40 percent and
39 percent of outstanding home equity loans at December 31, 2008 and
2007. These states accounted for $1.5 billion, or 55 percent, of non-
performing home equity loans at December 31, 2008. In addition, these
states represented 65 percent of the home equity net charge-offs for
2008. In the New York area, the New York-Northern New Jersey-Long
Island MSA made up 11 percent of outstanding home equity loans at
December 31, 2008 but comprised only five percent of net charge offs for
2008. The Los Angeles-Long Beach-Santa Ana MSA within California
made up 11 percent of outstanding home equity loans at December 31,
2008 and 11 percent of net charge-offs for 2008. The table above pres-
ents outstandings, nonperforming loans and net charge-offs by certain
state concentrations for the home equity portfolio.
Discontinued Real Estate
The discontinued real estate portfolio, totaling $20.0 billion at
December 31, 2008, consisted of pay-option and subprime loans
obtained in connection with the acquisition of Countrywide. At acquisition,
the majority of the discontinued real estate portfolio was considered
impaired and, in accordance with SOP 03-3, written down to fair value. At
December 31, 2008 the SOP 03-3 portfolio comprised $18.1 billion of
the $20.0 billion discontinued real estate portfolio. This portfolio is
included in All Other and is managed as part of our overall ALM activities.
See the SOP 03-3 portfolio discussion to follow for more information on
the discontinued real estate portfolio.
At December 31, 2008, the non SOP 03-3 discontinued real estate
portfolio was $1.9 billion. Loans with greater than 90 percent refreshed
LTVs and CLTVs comprised 13 percent of this portfolio and those with
refreshed FICO scores lower than 620 represented 17 percent of the
portfolio. California represented 31 percent of the portfolio and 22 per-
cent of the nonperforming loans while Florida represented 10 percent of
the portfolio and 17 percent of the nonperforming loans at December 31,
2008. The Los Angeles-Long Beach-Santa Ana MSA within California
made up 14 percent of outstanding discontinued real estate loans at
December 31, 2008.
SOP 03-3 Portfolio
Loans acquired with evidence of credit quality deterioration since origi-
nation and for which it is probable at purchase that we will be unable to
collect all contractually required payments are accounted for under SOP
03-3. Evidence of credit quality deterioration as of the purchase date may
include statistics such as past due status, refreshed borrower credit
scores, and refreshed LTVs, some of which were not immediately avail-
able as of the purchase date. SOP 03-3 addresses accounting for differ-
ences between contractual and expected cash flows to be collected from
the Corporation’s initial investment in loans if those differences are
attributable, at least in part, to credit quality. SOP 03-3 requires that
acquired impaired loans be recorded at fair value and prohibits “carrying
over” or the creation of valuation allowances in the initial accounting for
loans acquired that are within the scope of this SOP. The SOP 03-3
portfolio associated with the acquisition of LaSalle did not materially
impact results during 2008 and is excluded from the following dis-
cussion.
In accordance with SOP 03-3, certain acquired loans of Countrywide
that were considered impaired were written down to fair value at the
acquisition date. As a result, there were no reported net charge-offs in
2008 on these loans as the initial fair value at acquisition date would
have already considered the estimated credit losses on these loans. As
of December 31, 2008, the carrying value was $42.2 billion, excluding
the $750 million in incremental allowance, and the unpaid principal bal-
ance of these loans was $55.4 billion. SOP 03-3 does not apply to loans
Countrywide previously securitized as they are not held on the Corpo-
ration’s Balance Sheet. During 2008, had the acquired portfolios not
been subject to SOP 03-3, we would have recorded additional net charge-
offs of $3.6 billion, of which approximately 13 percent would have been
due to conforming accounting adjustments. Subsequent to the July 1,
2008 acquisition of Countrywide, the SOP 03-3 portfolio experienced fur-
ther credit deterioration due to weakness in the housing markets and the
impacts of a slowing economy. As such, we established a $750 million
allowance for loan loss through a charge to the provision for credit losses
comprised of $584 million for discontinued real estate loans and $166
million for home equity loans. For further information regarding loans
accounted for in accordance with SOP 03-3, see Note 6 – Outstanding
Loans and Leases to the Consolidated Financial Statements.
In the following paragraphs we provide additional information on the
residential mortgage, home equity and discontinued real estate loans that
were accounted for under SOP 03-3. Since these loans were written down
to fair value upon acquisition, we are reporting this information sepa-
rately. In certain cases, we supplement the reported statistics on these
SOP 03-3 portfolios with information that is presented as if the acquired
loans had not been subject to SOP 03-3.
Bank of America 2008
65