Bank of America 2008 Annual Report Download - page 93
Download and view the complete annual report
Please find page 93 of the 2008 Bank of America annual report below. You can navigate through the pages in the report by either clicking on the pages listed below, or by using the keyword search tool below to find specific information within the annual report.-
 1
1 -
2
-
3
-
4
-
5
-
6
-
7
-
8
-
9
-
10
-
11
-
12
-
13
-
14
-
15
-
16
-
17
-
18
-
19
-
20
-
21
-
22
-
23
-
24
-
25
-
26
-
27
-
28
-
29
-
30
-
31
-
32
-
33
-
34
-
35
-
36
-
37
-
38
-
39
-
40
-
41
-
42
-
43
-
44
-
45
-
46
-
47
-
48
-
49
-
50
-
51
-
52
-
53
-
54
-
55
-
56
-
57
-
58
-
59
-
60
-
61
-
62
-
63
-
64
-
65
-
66
-
67
-
68
-
69
-
70
-
71
-
72
-
73
-
74
-
75
-
76
-
77
-
78
-
79
-
80
-
81
-
82
-
 83
83 -
 84
84 -
 85
85 -
 86
86 -
 87
87 -
 88
88 -
 89
89 -
 90
90 -
 91
91 -
 92
92 -
 93
93 -
 94
94 -
 95
95 -
 96
96 -
 97
97 -
 98
98 -
 99
99 -
 100
100 -
 101
101 -
 102
102 -
 103
103 -
104
-
105
-
106
-
107
-
108
-
109
-
110
-
111
-
112
-
113
-
114
-
115
-
116
-
117
-
118
-
119
-
120
-
121
-
122
-
123
-
124
-
125
-
126
-
127
-
128
-
129
-
130
-
131
-
132
-
133
-
134
-
135
-
136
-
137
-
138
-
139
-
140
-
141
-
142
-
143
-
144
-
145
-
146
-
147
-
148
-
149
-
150
-
151
-
152
-
153
-
154
-
155
-
156
-
157
-
158
-
159
-
160
-
161
-
162
-
163
-
164
-
165
-
166
-
167
-
168
-
169
-
170
-
171
-
172
-
173
-
174
-
175
-
176
-
177
-
178
-
179
-
180
-
181
-
182
-
183
-
184
-
185
-
186
-
187
-
188
-
189
-
190
-
191
-
192
-
193
-
194
-
195
 |
 |

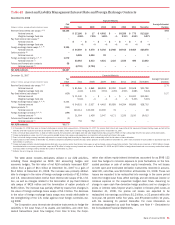
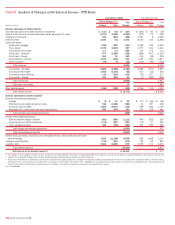
Table 42 Asset and Liability Management Interest Rate and Foreign Exchange Contracts
December 31, 2008
Fair
Value
Expected Maturity
(Dollars in millions, average estimated duration in years) Total 2009 2010 2011 2012 2013 Thereafter
Average Estimated
Duration
Receive fixed interest rate swaps
(1, 2)
$2,103 4.93
Notional amount
$ 27,166 $ 17 $ 4,002 $ – $9,258 $ 773 $13,116
Weighted average fixed rate
4.08% 7.35% 1.89% –% 3.31% 4.53% 5.27%
Pay fixed interest rate swaps
(1)
– –
Notional amount
$ –$ –$ –$–$–$–$ –
Weighted average fixed rate
–% –% –% –% –% –% –%
Foreign exchange basis swaps
(2, 3, 4)
3,196
Notional amount
$ 54,569 $ 4,578 $ 6,192 $3,986 $8,916 $4,819 $26,078
Option products
(5)
–
Notional amount
5,025 5,000 22 – – – 3
Foreign exchange contracts
(2, 4, 6)
1,070
Notional amount
(7)
23,063 2,313 4,021 1,116 1,535 486 13,592
Futures and forward rate contracts
58
Notional amount
(7)
(8,793) (8,793) –––– –
Net ALM contracts
$6,427
December 31, 2007
Fair
Value
Expected Maturity
(Dollars in millions, average estimated duration in years) Total 2008 2009 2010 2011 2012 Thereafter
Average Estimated
Duration
Receive fixed interest rate swaps
(1, 2)
$ 992 3.70
Notional amount $ 81,965 $ 4,869 $48,908 $3,252 $1,630 $2,508 $20,798
Weighted average fixed rate 4.34% 4.03% 3.91% 4.35% 4.50% 4.88% 5.34%
Pay fixed interest rate swaps
(1)
(429) 5.37
Notional amount $ 11,340 $ – $ – $ – $ – $1,000 $10,340
Weighted average fixed rate 5.04% –% –% –% –% 5.45% 5.00%
Foreign exchange basis swaps
(2, 3, 4)
6,164
Notional amount $ 54,531 $ 2,537 $ 4,463 $5,839 $4,294 $8,695 $28,703
Option products
(5)
(155)
Notional amount 140,114 130,000 10,000 76 – – 38
Foreign exchange contracts
(2, 4, 6)
(499)
Notional amount
(7)
31,054 1,438 2,047 4,171 1,235 3,150 19,013
Futures and forward rate contracts (3)
Notional amount
(7)
752752 –––– –
Net ALM contracts $6,070
(1) At December 31, 2008 there were no forward starting pay or receive fixed swap positions. At December 31, 2007, the receive fixed interest rate swap notional that represented forward starting swaps and will not be
effective until their respective contractual start dates was $45.0 billion. There were no forward starting pay fixed swap positions at December 31, 2007.
(2) Does not include basis adjustments on fixed rate debt issued by the Corporation and hedged under fair value hedge relationships pursuant to SFAS 133 that substantially offset the fair values of these derivatives.
(3) Foreign exchange basis swaps consist of cross-currency variable interest rate swaps used separately or in conjunction with receive fixed interest rate swaps.
(4) Does not include foreign currency translation adjustments on certain foreign debt issued by the Corporation which substantially offset the fair values of these derivatives.
(5) Option products of $5.0 billion at December 31, 2008 are comprised completely of purchased caps. Option products of $140.1 billion at December 31, 2007 were comprised of $120.1 billion in purchased caps and
$20.0 billion in sold floors.
(6) Foreign exchange contracts include foreign-denominated and cross-currency receive fixed interest rate swaps as well as foreign currency forward rate contracts. Total notional was comprised of $23.1 billion in foreign-
denominated and cross-currency receive fixed swaps and $78 million in foreign currency forward rate contracts at December 31, 2008, and $31.3 billion in foreign-denominated and cross-currency receive fixed swaps
and $211 million in foreign currency forward rate contracts at December 31, 2007.
(7) Reflects the net of long and short positions.
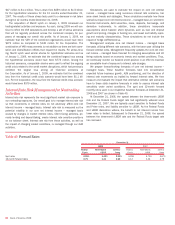
The table above includes derivatives utilized in our ALM activities,
including those designated as SFAS 133 accounting hedges and
economic hedges. The fair value of net ALM contracts increased $357
million from a gain of $6.1 billion at December 31, 2007 to a gain of
$6.4 billion at December 31, 2008. The increase was primarily attribut-
able to changes in the value of foreign exchange contracts of $1.6 billion
and U.S. dollar-denominated receive fixed interest rate swaps of $1.1 bil-
lion, as well as changes related to the termination of pay fixed interest
rate swaps of $429 million and the termination of option products of
$155 million. The increase was partially offset by losses from changes in
the value of foreign exchange basis swaps of $3.0 billion. The decrease
in the value of foreign exchange basis swaps was mostly attributable to
the strengthening of the U.S. dollar against most foreign currencies dur-
ing 2008.
The Corporation uses interest rate derivative instruments to hedge the
variability in the cash flows of its assets and liabilities, and other fore-
casted transactions (cash flow hedges). From time to time, the Corpo-
ration also utilizes equity-indexed derivatives accounted for as SFAS 133
cash flow hedges to minimize exposure to price fluctuations on the fore-
casted purchase or sale of certain equity investments. The net losses
on both open and terminated derivative instruments recorded in accumu-
lated OCI, net-of-tax, was $3.5 billion at December 31, 2008. These net
losses are expected to be reclassified into earnings in the same period
when the hedged cash flows affect earnings and will decrease income or
increase expense on the respective hedged cash flows. Assuming no
change in open cash flow derivative hedge positions and no changes to
prices or interest rates beyond what is implied in forward yield curves at
December 31, 2008, the pre-tax net losses are expected to be
reclassified into earnings as follows: $1.2 billion, or 23 percent within the
next year, 66 percent within five years, and 89 percent within 10 years,
with the remaining 11 percent thereafter. For more information on
derivatives designated as cash flow hedges, see Note 4 – Derivatives to
the Consolidated Financial Statements.
Bank of America 2008
91