Bank of America 2008 Annual Report Download - page 99
Download and view the complete annual report
Please find page 99 of the 2008 Bank of America annual report below. You can navigate through the pages in the report by either clicking on the pages listed below, or by using the keyword search tool below to find specific information within the annual report.-
 1
1 -
2
-
3
-
4
-
5
-
6
-
7
-
8
-
9
-
10
-
11
-
12
-
13
-
14
-
15
-
16
-
17
-
18
-
19
-
20
-
21
-
22
-
23
-
24
-
25
-
26
-
27
-
28
-
29
-
30
-
31
-
32
-
33
-
34
-
35
-
36
-
37
-
38
-
39
-
40
-
41
-
42
-
43
-
44
-
45
-
46
-
47
-
48
-
49
-
50
-
51
-
52
-
53
-
54
-
55
-
56
-
57
-
58
-
59
-
60
-
61
-
62
-
63
-
64
-
65
-
66
-
67
-
68
-
69
-
70
-
71
-
72
-
73
-
74
-
75
-
76
-
77
-
78
-
79
-
80
-
81
-
82
-
83
-
84
-
85
-
86
-
87
-
88
-
 89
89 -
 90
90 -
 91
91 -
 92
92 -
 93
93 -
 94
94 -
 95
95 -
 96
96 -
 97
97 -
 98
98 -
 99
99 -
 100
100 -
 101
101 -
 102
102 -
 103
103 -
 104
104 -
 105
105 -
 106
106 -
 107
107 -
 108
108 -
 109
109 -
110
-
111
-
112
-
113
-
114
-
115
-
116
-
117
-
118
-
119
-
120
-
121
-
122
-
123
-
124
-
125
-
126
-
127
-
128
-
129
-
130
-
131
-
132
-
133
-
134
-
135
-
136
-
137
-
138
-
139
-
140
-
141
-
142
-
143
-
144
-
145
-
146
-
147
-
148
-
149
-
150
-
151
-
152
-
153
-
154
-
155
-
156
-
157
-
158
-
159
-
160
-
161
-
162
-
163
-
164
-
165
-
166
-
167
-
168
-
169
-
170
-
171
-
172
-
173
-
174
-
175
-
176
-
177
-
178
-
179
-
180
-
181
-
182
-
183
-
184
-
185
-
186
-
187
-
188
-
189
-
190
-
191
-
192
-
193
-
194
-
195
 |
 |
Consolidation and Accounting for Variable Interest
Entities
Under the provisions of FIN 46R, a VIE is consolidated by the entity that
will absorb a majority of the variability created by the assets of the VIE.
The calculation of variability is based on an analysis of projected
probability-weighted cash flows based on the design of the particular VIE.
Scenarios in which expected cash flows are less than or greater than the
expected outcomes create expected losses or expected residual returns.
The entity that will absorb a majority of expected variability (the sum of
the absolute values of the expected losses and expected residual
returns) consolidates the VIE and is referred to as the primary beneficiary.
A variety of qualitative and quantitative assumptions are used to
estimate projected cash flows and the relative probability of each poten-
tial outcome, and to determine which parties will absorb expected losses
and expected residual returns. Critical assumptions, which may include
projected credit losses and interest rates, are independently verified
against market observable data where possible. Where market
observable data is not available, the results of the analysis become more
subjective.
As certain events occur, we reevaluate which parties will absorb varia-
bility and whether we have become or are no longer the primary benefi-
ciary. Reconsideration events may occur when VIEs acquire additional
assets, issue new variable interests or enter into new or modified con-
tractual arrangements. A reconsideration event may also occur when we
acquire new or additional interests in a VIE.
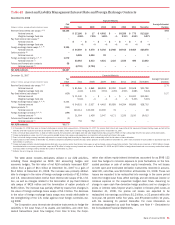
In the unlikely event we were required to consolidate our uncon-
solidated VIEs, their consolidation would increase our assets and
liabilities and could have an adverse impact on our Tier 1 Capital, Total
Capital and Tier 1 Leverage Capital ratios under current GAAP. On Sep-
tember 15, 2008 the FASB released exposure drafts which would amend
SFAS 140 and FIN 46R. For additional information on this proposed
amendment, see Recent Accounting Developments on page 23.
For more information, see Note 9 – Variable Interest Entities to the
Consolidated Financial Statements.
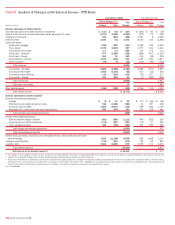
2007 Compared to 2006
The following discussion and analysis provides a comparison of our
results of operations for 2007 and 2006. This discussion should be read
in conjunction with the Consolidated Financial Statements and related
Notes. Tables 5 and 6 contain financial data to supplement this dis-
cussion.
Overview
Net Income
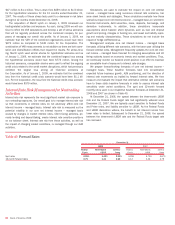
Net income totaled $15.0 billion, or $3.30 per diluted common share in
2007 compared to $21.1 billion or $4.59 per diluted common share in
2006. The return on average common shareholders’ equity was 11.08
percent in 2007 compared to 16.27 percent in 2006. These earnings
provided sufficient cash flow to allow us to return $13.6 billion and $21.2
billion in 2007 and 2006, in capital to shareholders in the form of divi-
dends and share repurchases, net of employee stock options exercised.
Net Interest Income
Net interest income on a FTE basis increased $372 million to $36.2 bil-
lion in 2007 compared to 2006. The increase was driven by the con-
tribution from market-based net interest income related to our CMAS
business, higher levels of consumer and commercial loans, the impact of
the LaSalle acquisition, and a one-time tax benefit from restructuring our
existing non-U.S. based commercial aircraft leasing business. These
increases were partially offset by spread compression, increased hedge
costs and the impact of divestitures of certain foreign operations in late
2006 and the beginning of 2007. The net interest yield on a FTE basis
decreased 22 bps to 2.60 percent for 2007 compared to 2006, and was
driven by spread compression and the impact of the funding of the
LaSalle merger, partially offset by an improvement in market-based yield
related to our CMAS business.
Noninterest Income
Noninterest income decreased $5.8 billion to $32.4 billion in 2007
compared to 2006 due primarily to decreases in trading account profits
(losses) of $8.2 billion and other income of $916 million. These
decreases were partially offset by increases in equity investment income
of $875 million, investment and brokerage services of $691 million, serv-
ice charges of $684 million, an increase in gains (losses) on sales of
debt securities of $623 million and mortgage banking income of $361
million. Trading account profits (losses) were driven by losses of $4.9 bil-
lion associated with CDO exposure and the impact of the market dis-
ruptions on various parts of our CMAS businesses in the second half of
the year. The decrease in other income was driven by losses of $752
million associated with CDO exposure, losses of $776 million associated
with the support provided to certain cash funds managed within GWIM
and writedowns related to certain SIV investments that were purchased
from the funds, and the absence of a $720 million gain on the sale of our
Brazilian operations recognized in 2006. These losses were partially off-
set by a $1.5 billion gain from the sale of Marsico that was recorded in
other income. The increase in equity investment income was driven by the
$600 million gain on the sale of private equity funds to Conversus Capi-
tal. Investment and brokerage services increased due primarily to organic
growth in AUM, brokerage activity and the U.S. Trust Corporation acquis-
ition. Service charges grew resulting from new account growth in deposit
accounts and the beneficial impact of the LaSalle merger. The increase in
gains (losses) on sales of debt securities was driven largely by losses in
the prior year. Mortgage banking income increased due to the favorable
performance of the MSRs partially offset by the impact of widening credit
spreads on income from mortgage production.
Provision for Credit Losses
The provision for credit losses increased $3.4 billion to $8.4 billion in
2007 compared to 2006 due to higher net charge-offs, reserve additions
and the absence of 2006 commercial reserve releases. Higher net
charge-offs of $1.9 billion were primarily driven by seasoning of the con-
sumer portfolios, seasoning and deterioration in the small business and
home equity portfolios as well as lower commercial recoveries. Reserves
were increased in the home equity and homebuilder loan portfolios on
continued weakness in the housing market. Reserves were also added for
small business portfolio seasoning and deterioration as well as growth in
the consumer portfolios. These increases were partially offset by reduc-
tions in reserves from the sale of the Argentina portfolio in the first quar-
ter of 2007.
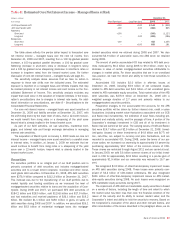
Noninterest Expense
Noninterest expense increased $1.7 billion to $37.5 billion in 2007
compared to 2006, primarily due to increases in other general operating
expense of $975 million and personnel expense of $542 million, partially
offset by a decrease in merger and restructuring charges of $395 million.
The increase in other general operating expense was impacted by our
acquisitions and various other items including litigation related costs.
Personnel expense increased due to the acquisitions of LaSalle and U.S.
Trust Corporation partially offset by a reduction in performance-based
Bank of America 2008
97