Bank of America 2008 Annual Report Download - page 104
Download and view the complete annual report
Please find page 104 of the 2008 Bank of America annual report below. You can navigate through the pages in the report by either clicking on the pages listed below, or by using the keyword search tool below to find specific information within the annual report.-
 1
1 -
2
-
3
-
4
-
5
-
6
-
7
-
8
-
9
-
10
-
11
-
12
-
13
-
14
-
15
-
16
-
17
-
18
-
19
-
20
-
21
-
22
-
23
-
24
-
25
-
26
-
27
-
28
-
29
-
30
-
31
-
32
-
33
-
34
-
35
-
36
-
37
-
38
-
39
-
40
-
41
-
42
-
43
-
44
-
45
-
46
-
47
-
48
-
49
-
50
-
51
-
52
-
53
-
54
-
55
-
56
-
57
-
58
-
59
-
60
-
61
-
62
-
63
-
64
-
65
-
66
-
67
-
68
-
69
-
70
-
71
-
72
-
73
-
74
-
75
-
76
-
77
-
78
-
79
-
80
-
81
-
82
-
83
-
84
-
85
-
86
-
87
-
88
-
89
-
90
-
91
-
92
-
93
-
 94
94 -
 95
95 -
 96
96 -
 97
97 -
 98
98 -
 99
99 -
 100
100 -
 101
101 -
 102
102 -
 103
103 -
 104
104 -
 105
105 -
 106
106 -
 107
107 -
 108
108 -
 109
109 -
 110
110 -
 111
111 -
 112
112 -
 113
113 -
 114
114 -
115
-
116
-
117
-
118
-
119
-
120
-
121
-
122
-
123
-
124
-
125
-
126
-
127
-
128
-
129
-
130
-
131
-
132
-
133
-
134
-
135
-
136
-
137
-
138
-
139
-
140
-
141
-
142
-
143
-
144
-
145
-
146
-
147
-
148
-
149
-
150
-
151
-
152
-
153
-
154
-
155
-
156
-
157
-
158
-
159
-
160
-
161
-
162
-
163
-
164
-
165
-
166
-
167
-
168
-
169
-
170
-
171
-
172
-
173
-
174
-
175
-
176
-
177
-
178
-
179
-
180
-
181
-
182
-
183
-
184
-
185
-
186
-
187
-
188
-
189
-
190
-
191
-
192
-
193
-
194
-
195
 |
 |

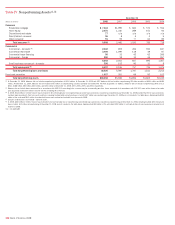
Table IV Nonperforming Assets (1, 2)
December 31
(Dollars in millions) 2008 2007 2006 2005 2004
Consumer
Residential mortgage
$ 7,044
$1,999 $ 660 $ 570 $ 554
Home equity
2,670
1,340 289 151 94
Discontinued real estate
77
n/a n/a n/a n/a
Direct/Indirect consumer
26
8435
Other consumer
91
95 77 61 85
Total consumer (3)
9,908
3,442 1,030 785 738
Commercial
Commercial – domestic
(4)
2,040
852 494 550 847
Commercial real estate
3,906
1,099 118 49 87
Commercial lease financing
56
33 42 62 266
Commercial – foreign
290
19 13 34 267
6,292
2,003 667 695 1,467
Small business commercial – domestic
205
152 90 31 8
Total commercial (5)
6,497
2,155 757 726 1,475
Total nonperforming loans and leases
16,405
5,597 1,787 1,511 2,213
Foreclosed properties
1,827
351 69 92 102
Total nonperforming assets
$18,232
$5,948 $1,856 $1,603 $2,315
(1) At December 31, 2008, balances did not include nonperforming derivatives of $512 million. At December 31, 2008 and 2007 balances did not include nonperforming AFS debt securities of $291 million and $180
million. At December 31, 2004, balances did not include $140 million of nonperforming securities primarily associated with the Fleet acquisition. In addition, balances did not include nonperforming LHFS of $1.3
billion, $188 million, $80 million, $69 million, and $151 million at December 31, 2008, 2007, 2006, 2005, and 2004, respectively.
(2) Balances do not include loans accounted for in accordance with SOP 03-3 even though the customer may be contractually past due. Loans accounted for in accordance with SOP 03-3 were written down to fair value
upon acquisition and accrete interest income over the remaining life of the loan.
(3) In 2008, $512 million in interest income was estimated to be contractually due on nonperforming consumer loans and leases classified as nonperforming at December 31, 2008 provided that these loans and leases
had been paid according to their terms and conditions, including troubled debt restructured loans of which $387 million were performing at December 31, 2008 and not included in the table above. Approximately $124
million of the estimated $512 million in contractual interest was received and included in net income for 2008.
(4) Excludes small business commercial – domestic loans.
(5) In 2008, $260 million in interest income was estimated to be contractually due on nonperforming commercial loans and leases classified as nonperforming at December 31, 2008, including troubled debt restructured
loans of which $13 million were performing at December 31, 2008 and not included in the table above. Approximately $84 million of the estimated $260 million in contractual interest was received and included in net
income for 2008.
n/a = not applicable
102
Bank of America 2008