Bank of America 2008 Annual Report Download - page 56
Download and view the complete annual report
Please find page 56 of the 2008 Bank of America annual report below. You can navigate through the pages in the report by either clicking on the pages listed below, or by using the keyword search tool below to find specific information within the annual report.-
 1
1 -
2
-
3
-
4
-
5
-
6
-
7
-
8
-
9
-
10
-
11
-
12
-
13
-
14
-
15
-
16
-
17
-
18
-
19
-
20
-
21
-
22
-
23
-
24
-
25
-
26
-
27
-
28
-
29
-
30
-
31
-
32
-
33
-
34
-
35
-
36
-
37
-
38
-
39
-
40
-
41
-
42
-
43
-
44
-
45
-
 46
46 -
 47
47 -
 48
48 -
 49
49 -
 50
50 -
 51
51 -
 52
52 -
 53
53 -
 54
54 -
 55
55 -
 56
56 -
 57
57 -
 58
58 -
 59
59 -
 60
60 -
 61
61 -
 62
62 -
 63
63 -
 64
64 -
 65
65 -
 66
66 -
67
-
68
-
69
-
70
-
71
-
72
-
73
-
74
-
75
-
76
-
77
-
78
-
79
-
80
-
81
-
82
-
83
-
84
-
85
-
86
-
87
-
88
-
89
-
90
-
91
-
92
-
93
-
94
-
95
-
96
-
97
-
98
-
99
-
100
-
101
-
102
-
103
-
104
-
105
-
106
-
107
-
108
-
109
-
110
-
111
-
112
-
113
-
114
-
115
-
116
-
117
-
118
-
119
-
120
-
121
-
122
-
123
-
124
-
125
-
126
-
127
-
128
-
129
-
130
-
131
-
132
-
133
-
134
-
135
-
136
-
137
-
138
-
139
-
140
-
141
-
142
-
143
-
144
-
145
-
146
-
147
-
148
-
149
-
150
-
151
-
152
-
153
-
154
-
155
-
156
-
157
-
158
-
159
-
160
-
161
-
162
-
163
-
164
-
165
-
166
-
167
-
168
-
169
-
170
-
171
-
172
-
173
-
174
-
175
-
176
-
177
-
178
-
179
-
180
-
181
-
182
-
183
-
184
-
185
-
186
-
187
-
188
-
189
-
190
-
191
-
192
-
193
-
194
-
195
 |
 |
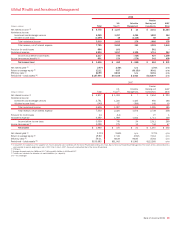
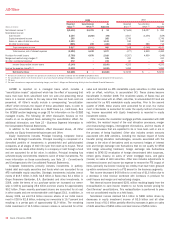
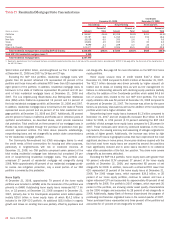
Purchases, Issuances and Settlements
During 2008, we had net purchases of $2.8 billion of Level 3 AFS debt
securities, net settlements of $2.1 billion of Level 3 trading account
assets, and net purchases of $1.4 billion in net derivatives. The net
purchases in Level 3 AFS debt securities were driven by the addition of
certain securities that were purchased from our GWIM cash funds, as well
as purchases of ARS, mortgage-backed securities and collateralized
mortgage obligations. These purchases were partially offset by settle-
ments of certain CDO-related exposures. The settlements for trading
account assets were primarily related to the liquidation of certain CDO
vehicles, partially offset by the purchase of ARS pursuant to our agree-
ments to purchase certain ARS from our customers. For more information
on our ARS agreements see Recent Events on page 22. The net settle-
ments of derivative liabilities were driven by the extinguishment of our
liquidity exposure to certain CDO vehicles.
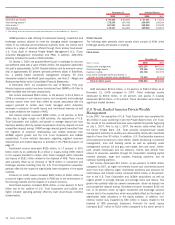
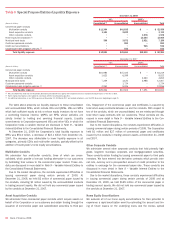
Transfers into or out of Level 3
Transfers into or out of Level 3 are made if the inputs used in the finan-
cial models measuring the fair values of the assets and liabilities became
unobservable or observable, respectively, in the current marketplace.
These transfers are effective as of the beginning of the quarter, therefore
Table 10 considers any gains or losses occurring on these assets and
liabilities during each quarter that they are classified as Level 3.
During 2008, several transfers were made into or out of Level 3. AFS
debt securities of $14.1 billion and trading account assets of $7.2 billion
were transferred into Level 3. Included in the $14.1 billion of AFS debt
securities were assets of certain consolidated multi-seller conduits and
securities in the form of commercial paper issued by CDOs. Included in
the $7.2 billion of transfers of trading account assets were student loan
ARS, certain bond positions, and asset-backed securities. These assets
were transferred due to a lack of liquidity in the marketplace. In light of
the illiquidity, we implemented a change to our valuation approach for
these instruments, basing the valuation on assumptions about the
weighted average life of the security, estimated future coupons to be paid
and spreads observed in pricing of similar instruments.
Managing Risk
Overview
Our management governance structure enables us to manage all major
aspects of our business through our planning and review process that
includes strategic, financial, associate, customer and risk planning. We
derive much of our revenue from managing risk from customer trans-
actions for profit. In addition to qualitative factors, we utilize quantitative
measures to optimize risk and reward trade offs in order to achieve
growth targets and financial objectives while reducing the variability of
earnings and minimizing unexpected losses. Risk metrics that allow us to
measure performance include economic capital targets and corporate risk
limits. By allocating economic capital to a line of business, we effectively
manage the ability to take on risk. Review and approval of business plans
incorporate approval of economic capital allocation, and economic capital
usage is monitored through financial and risk reporting. Industry, country,
trading, asset allocation and other limits supplement the allocation of
economic capital. These limits are based on an analysis of risk and
reward in each line of business and management is responsible for track-
ing and reporting performance measurements as well as any exceptions
to guidelines or limits. Our risk management process continually eval-
uates risk and appropriate metrics needed to measure it.
Our business exposes us to the following major risks: strategic, liquid-
ity, credit, market, compliance and operational risk. Strategic risk is the
risk that adverse business decisions, ineffective or inappropriate busi-
ness plans or failure to respond to changes in the competitive environ-
ment, business cycles, customer preferences, product obsolescence,
execution and/or other intrinsic risks of business will impact our ability to
meet our objectives. Liquidity risk is the inability to accommodate liability
maturities and deposit withdrawals, fund asset growth and meet con-
tractual obligations through unconstrained access to funding at reason-
able market rates. Credit risk is the risk of loss arising from a borrower’s
or counterparty’s inability to meet its obligations. Market risk is the risk
that values of assets and liabilities or revenues will be adversely affected
by changes in market conditions, such as interest rate movements.
Compliance risk is the risk posed by the failure to manage regulatory,
legal and ethical issues that could result in monetary damages, losses or
harm to the bank’s reputation or image. Operational risk is the risk of
loss resulting from inadequate or failed internal processes, people and
systems or external events. The following sections, Strategic Risk Man-
agement on page 55, Liquidity Risk and Capital Management beginning
on page 55, Credit Risk Management beginning on page 61, Market Risk
Management beginning on page 84, and Compliance and Operational
Risk Management beginning on page 92, address in more detail the
specific procedures, measures and analyses of the major categories of
risk that we manage.
Risk Management Processes and Methods
We have established and continually enhance control processes and use
various methods to align risk-taking and risk management throughout our
organization. These control processes and methods are designed around
“three lines of defense”: lines of business, enterprise functions and
Corporate Audit.
The lines of business are the first line of defense and are responsible
for identifying, quantifying, mitigating and monitoring all risks within their
lines of business, while certain enterprise-wide risks are managed cen-
trally. For example, except for trading-related business activities, interest
rate risk associated with our business activities is managed centrally as
part of our ALM activities. Line of business management makes and
executes the business plan and is closest to the changing nature of risks
and, therefore, we believe is best able to take actions to manage and
mitigate those risks. Our lines of business prepare periodic self-
assessment reports to identify the status of risk issues, including miti-
gation plans, if appropriate. These reports roll up to executive
management to ensure appropriate risk management and oversight, and
to identify enterprise-wide issues. Our management processes, structures
and policies aid us in complying with laws and regulations and provide
clear lines for decision-making and accountability. Wherever practical, we
attempt to house decision-making authority as close to the transaction as
possible while retaining supervisory control functions from both in and
outside of the lines of business.
The key elements of the second line of defense are our Risk Manage-
ment, Compliance, Finance and Treasury, Human Resources, and Legal
functions. These groups are independent of the lines of businesses and
are organized on both a line of business and enterprise-wide basis. For
example, for Risk Management, a senior risk executive is assigned to
each of the lines of business and is responsible for the oversight of all
the risks associated with that line of business. Enterprise-level risk
executives have responsibility to develop and implement polices and
practices to assess and manage enterprise-wide credit, market and
operational risks.
Corporate Audit, the third line of defense, provides an independent
assessment of our management and internal control systems. Corporate
Audit activities are designed to provide reasonable assurance that
resources are adequately protected; significant financial, managerial and
operating information is materially complete, accurate and reliable; and
54
Bank of America 2008