Bank of America 2008 Annual Report Download - page 179
Download and view the complete annual report
Please find page 179 of the 2008 Bank of America annual report below. You can navigate through the pages in the report by either clicking on the pages listed below, or by using the keyword search tool below to find specific information within the annual report.-
 1
1 -
2
-
3
-
4
-
5
-
6
-
7
-
8
-
9
-
10
-
11
-
12
-
13
-
14
-
15
-
16
-
17
-
18
-
19
-
20
-
21
-
22
-
23
-
24
-
25
-
26
-
27
-
28
-
29
-
30
-
31
-
32
-
33
-
34
-
35
-
36
-
37
-
38
-
39
-
40
-
41
-
42
-
43
-
44
-
45
-
46
-
47
-
48
-
49
-
50
-
51
-
52
-
53
-
54
-
55
-
56
-
57
-
58
-
59
-
60
-
61
-
62
-
63
-
64
-
65
-
66
-
67
-
68
-
69
-
70
-
71
-
72
-
73
-
74
-
75
-
76
-
77
-
78
-
79
-
80
-
81
-
82
-
83
-
84
-
85
-
86
-
87
-
88
-
89
-
90
-
91
-
92
-
93
-
94
-
95
-
96
-
97
-
98
-
99
-
100
-
101
-
102
-
103
-
104
-
105
-
106
-
107
-
108
-
109
-
110
-
111
-
112
-
113
-
114
-
115
-
116
-
117
-
118
-
119
-
120
-
121
-
122
-
123
-
124
-
125
-
126
-
127
-
128
-
129
-
130
-
131
-
132
-
133
-
134
-
135
-
136
-
137
-
138
-
139
-
140
-
141
-
142
-
143
-
144
-
145
-
146
-
147
-
148
-
149
-
150
-
151
-
152
-
153
-
154
-
155
-
156
-
157
-
158
-
159
-
160
-
161
-
162
-
163
-
164
-
165
-
166
-
167
-
168
-
 169
169 -
 170
170 -
 171
171 -
 172
172 -
 173
173 -
 174
174 -
 175
175 -
 176
176 -
 177
177 -
 178
178 -
 179
179 -
 180
180 -
 181
181 -
 182
182 -
 183
183 -
 184
184 -
 185
185 -
 186
186 -
 187
187 -
 188
188 -
 189
189 -
190
-
191
-
192
-
193
-
194
-
195
 |
 |

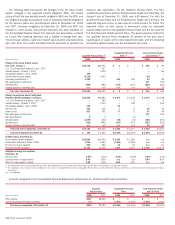
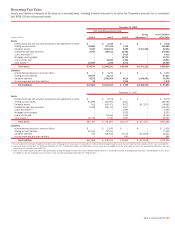
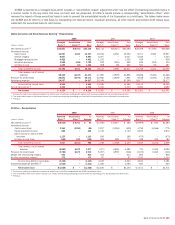
Recurring Fair Value
Assets and liabilities measured at fair value on a recurring basis, including financial instruments for which the Corporation accounts for in accordance
with SFAS 159 are summarized below:
December 31, 2008
Fair Value Measurements Using
(Dollars in millions) Level 1 Level 2 Level 3
Netting
Adjustments
(1)
Assets/Liabilities
at Fair Value
Assets
Federal funds sold and securities purchased under agreements to resell
$–
$ 2,330 $ – $ – $ 2,330
Trading account assets
44,889
107,315 7,318 – 159,522
Derivative assets
2,109
1,525,106 8,289 (1,473,252) 62,252
Available-for-sale debt securities
2,789
255,413 18,702 – 276,904
Loans and leases
(2)
–
– 5,413 – 5,413
Mortgage servicing rights
–
– 12,733 – 12,733
Loans held-for-sale
–
15,582 3,382 – 18,964
Other assets
(3)
25,089
1,245 3,572 – 29,906
Total assets
$ 74,876
$1,906,991 $ 59,409 $(1,473,252) $ 568,024
Liabilities
Interest-bearing deposits in domestic offices
$–
$ 1,717 $ – $ – $ 1,717
Trading account liabilities
42,974
14,313 – – 57,287
Derivative liabilities
4,872
1,488,509 6,019 (1,468,691) 30,709
Accrued expenses and other liabilities
38
– 1,940 – 1,978
Total liabilities
$ 47,884
$1,504,539 $ 7,959 $(1,468,691) $ 91,691
December 31, 2007
Assets
Federal funds sold and securities purchased under agreements to resell
$–
$ 2,578 $ – $ – $ 2,578
Trading account assets
42,986
115,051 4,027 – 162,064
Derivative assets
516
442,471 8,972 (417,297) 34,662
Available-for-sale debt securities
2,089
205,734 5,507 – 213,330
Loans and leases
(2)
–
– 4,590 – 4,590
Mortgage servicing rights
–
– 3,053 – 3,053
Loans held-for-sale
–
14,431 1,334 – 15,765
Other assets
(3)
19,796
1,540 3,987 – 25,323
Total assets
$65,387
$ 781,805 $31,470 $ (417,297) $461,365
Liabilities
Interest-bearing deposits in domestic offices
$–
$ 2,000 $ – $ – $ 2,000
Trading account liabilities
57,331
20,011 – – 77,342
Derivative liabilities
534
426,223 10,175 (414,509) 22,423
Accrued expenses and other liabilities
–
– 660 – 660
Total liabilities
$57,865
$ 448,234 $10,835 $ (414,509) $102,425
(1) Amounts represent the impact of legally enforceable master netting agreements that allow the Corporation to settle positive and negative positions and also cash collateral held or placed with the same counterparties.
(2) Loans and leases at December 31, 2008 and December 31, 2007 included $22.4 billion and $22.6 billion of leases that were not eligible for the fair value option as leases are specifically excluded from fair value
option election in accordance with SFAS 159.
(3) Other assets include equity investments held by Principal Investing, AFS equity securities and certain retained residual interests in securitization vehicles, including interest-only strips. Substantially all of other assets
are eligible for, and the Corporation has not chosen to elect, fair value accounting at December 31, 2008 and 2007.
Bank of America 2008
177