Bank of America 2008 Annual Report Download - page 77
Download and view the complete annual report
Please find page 77 of the 2008 Bank of America annual report below. You can navigate through the pages in the report by either clicking on the pages listed below, or by using the keyword search tool below to find specific information within the annual report.-
 1
1 -
2
-
3
-
4
-
5
-
6
-
7
-
8
-
9
-
10
-
11
-
12
-
13
-
14
-
15
-
16
-
17
-
18
-
19
-
20
-
21
-
22
-
23
-
24
-
25
-
26
-
27
-
28
-
29
-
30
-
31
-
32
-
33
-
34
-
35
-
36
-
37
-
38
-
39
-
40
-
41
-
42
-
43
-
44
-
45
-
46
-
47
-
48
-
49
-
50
-
51
-
52
-
53
-
54
-
55
-
56
-
57
-
58
-
59
-
60
-
61
-
62
-
63
-
64
-
65
-
66
-
 67
67 -
 68
68 -
 69
69 -
 70
70 -
 71
71 -
 72
72 -
 73
73 -
 74
74 -
 75
75 -
 76
76 -
 77
77 -
 78
78 -
 79
79 -
 80
80 -
 81
81 -
 82
82 -
 83
83 -
 84
84 -
 85
85 -
 86
86 -
 87
87 -
88
-
89
-
90
-
91
-
92
-
93
-
94
-
95
-
96
-
97
-
98
-
99
-
100
-
101
-
102
-
103
-
104
-
105
-
106
-
107
-
108
-
109
-
110
-
111
-
112
-
113
-
114
-
115
-
116
-
117
-
118
-
119
-
120
-
121
-
122
-
123
-
124
-
125
-
126
-
127
-
128
-
129
-
130
-
131
-
132
-
133
-
134
-
135
-
136
-
137
-
138
-
139
-
140
-
141
-
142
-
143
-
144
-
145
-
146
-
147
-
148
-
149
-
150
-
151
-
152
-
153
-
154
-
155
-
156
-
157
-
158
-
159
-
160
-
161
-
162
-
163
-
164
-
165
-
166
-
167
-
168
-
169
-
170
-
171
-
172
-
173
-
174
-
175
-
176
-
177
-
178
-
179
-
180
-
181
-
182
-
183
-
184
-
185
-
186
-
187
-
188
-
189
-
190
-
191
-
192
-
193
-
194
-
195
 |
 |

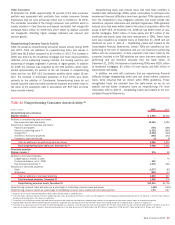
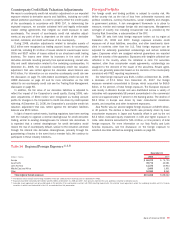
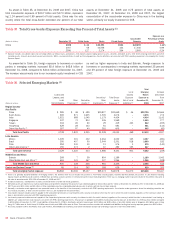
Nonperforming Commercial Assets Activity
Table 29 presents the additions and reductions to nonperforming assets
in the commercial portfolio during 2008 and 2007. The increase in non-
accrual loans and leases for 2008 was primarily attributable to continued
weakness in the homebuilder sector but also included smaller increases
in other property types including commercial land development, retail and
apartments.
Table 29 Nonperforming Commercial Assets Activity (1, 2, 3)
(Dollars in millions) 2008 2007
Nonperforming loans and leases
Balance, January 1
$ 2,155
$ 757
Additions to nonperforming loans and leases:
New nonaccrual loans and leases
8,110
2,880
Advances
154
85
Reductions in nonperforming loans and leases:
Paydowns and payoffs
(1,467)
(781)
Sales
(45)
(82)
Returns to performing status
(4)
(125)
(239)
Charge-offs
(5)
(1,900)
(370)
Transfers to foreclosed properties
(372)
(75)
Transfers to loans held-for-sale
(13)
(20)
Total net additions to nonperforming loans and leases
4,342
1,398
Total nonperforming loans and leases, December 31
6,497
2,155
Foreclosed properties
Balance, January 1
75
10
Additions to foreclosed properties:
New foreclosed properties
372
91
Reductions in foreclosed properties:
Sales
(110)
(22)
Writedowns
(16)
(4)
Total net additions to foreclosed properties
246
65
Total foreclosed properties, December 31
321
75
Nonperforming commercial assets, December 31
$ 6,818
$2,230
Nonperforming commercial loans and leases as a percentage of outstanding commercial loans and leases
(6)
1.93%
0.67%
Nonperforming commercial assets as a percentage of outstanding commercial loans and leases and foreclosed properties
(6)
2.02
0.70
(1) Balances do not include nonperforming LHFS of $852 million and $93 million at December 31, 2008 and 2007. Balances do not include nonperforming AFS debt securities of $291 million and $180 million at
December 31, 2008 and 2007.
(2) Balances do not include nonperforming derivative assets of $512 million at December 31, 2008.
(3) Includes small business commercial – domestic activity.
(4) Commercial loans and leases may be restored to performing status when all principal and interest is current and full repayment of the remaining contractual principal and interest is expected, or when the loan
otherwise becomes well-secured and is in the process of collection.
(5) Certain loan and lease products, including business card, are not classified as nonperforming; therefore, the charge-offs on these loans have no impact on nonperforming activity.
(6) Outstanding commercial loans and leases exclude loans measured at fair value in accordance with SFAS 159.
Bank of America 2008
75