Bank of America 2008 Annual Report Download - page 88
Download and view the complete annual report
Please find page 88 of the 2008 Bank of America annual report below. You can navigate through the pages in the report by either clicking on the pages listed below, or by using the keyword search tool below to find specific information within the annual report.-
 1
1 -
2
-
3
-
4
-
5
-
6
-
7
-
8
-
9
-
10
-
11
-
12
-
13
-
14
-
15
-
16
-
17
-
18
-
19
-
20
-
21
-
22
-
23
-
24
-
25
-
26
-
27
-
28
-
29
-
30
-
31
-
32
-
33
-
34
-
35
-
36
-
37
-
38
-
39
-
40
-
41
-
42
-
43
-
44
-
45
-
46
-
47
-
48
-
49
-
50
-
51
-
52
-
53
-
54
-
55
-
56
-
57
-
58
-
59
-
60
-
61
-
62
-
63
-
64
-
65
-
66
-
67
-
68
-
69
-
70
-
71
-
72
-
73
-
74
-
75
-
76
-
77
-
 78
78 -
 79
79 -
 80
80 -
 81
81 -
 82
82 -
 83
83 -
 84
84 -
 85
85 -
 86
86 -
 87
87 -
 88
88 -
 89
89 -
 90
90 -
 91
91 -
 92
92 -
 93
93 -
 94
94 -
 95
95 -
 96
96 -
 97
97 -
 98
98 -
99
-
100
-
101
-
102
-
103
-
104
-
105
-
106
-
107
-
108
-
109
-
110
-
111
-
112
-
113
-
114
-
115
-
116
-
117
-
118
-
119
-
120
-
121
-
122
-
123
-
124
-
125
-
126
-
127
-
128
-
129
-
130
-
131
-
132
-
133
-
134
-
135
-
136
-
137
-
138
-
139
-
140
-
141
-
142
-
143
-
144
-
145
-
146
-
147
-
148
-
149
-
150
-
151
-
152
-
153
-
154
-
155
-
156
-
157
-
158
-
159
-
160
-
161
-
162
-
163
-
164
-
165
-
166
-
167
-
168
-
169
-
170
-
171
-
172
-
173
-
174
-
175
-
176
-
177
-
178
-
179
-
180
-
181
-
182
-
183
-
184
-
185
-
186
-
187
-
188
-
189
-
190
-
191
-
192
-
193
-
194
-
195
 |
 |

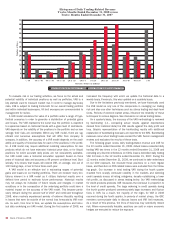
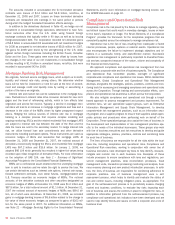
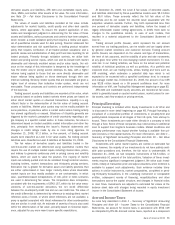
Histogram of Daily Trading-Related Revenue
Twelve Months Ended December 31, 2008 versus
Twelve Months Ended December 31, 2007
0
4
8
12
16
20
24
28
32
36
40
44
48
52
Revenue (dollars in millions)
Number of Days
Twelve Months Ended December 31, 2008 Twelve Months Ended December 31, 2007
< -50 -50 to -40 -40 to -30 -30 to -20 -20 to -10 -10 to 0 0 to 10 10 to 20 20 to 30 30 to 40 40 to 50 > 50
To evaluate risk in our trading activities, we focus on the actual and
potential volatility of individual positions as well as portfolios. VAR is a
key statistic used to measure market risk. In order to manage day-to-day
risks, VAR is subject to trading limits both for our overall trading portfolio
and within individual businesses. All limit excesses are communicated to
management for review.
A VAR model simulates the value of a portfolio under a range of hypo-
thetical scenarios in order to generate a distribution of potential gains
and losses. The VAR represents the worst loss the portfolio is expected
to experience based on historical trends with a given level of confidence.
VAR depends on the volatility of the positions in the portfolio and on how
strongly their risks are correlated. Within any VAR model, there are sig-
nificant and numerous assumptions that will differ from company to
company. In addition, the accuracy of a VAR model depends on the avail-
ability and quality of historical data for each of the positions in the portfo-
lio. A VAR model may require additional modeling assumptions for new
products which do not have extensive historical price data, or for illiquid
positions for which accurate daily prices are not consistently available.
Our VAR model uses a historical simulation approach based on three
years of historical data and assumes a 99 percent confidence level. Stat-
istically, this means that losses will exceed VAR, on average, one out of
100 trading days, or two to three times each year.
A VAR model is an effective tool in estimating ranges of potential
gains and losses on our trading portfolios. There are however many limi-
tations inherent in a VAR model as it utilizes historical results over a
defined time period to estimate future performance. Historical results
may not always be indicative of future results and changes in market
conditions or in the composition of the underlying portfolio could have a
material impact on the accuracy of the VAR model. This became partic-
ularly relevant during the second half of 2007 and continued throughout
2008, when markets experienced periods of extreme illiquidity resulting
in losses that were far outside of the normal loss forecasts by VAR mod-
els. As such, from time to time, we update the assumptions and histor-
ical data underlying our VAR model. During the first quarter of 2008, we
increased the frequency with which we update the historical data to a
weekly basis. Previously, this was updated on a quarterly basis.
Due to the limitations previously mentioned, we have historically used
the VAR model as only one of the components in managing our trading
risk and also use other techniques such as stress testing and desk level
limits. Periods of extreme market stress influence the reliability of these
techniques to various degrees. See discussion on stress testing below.
On a quarterly basis, the accuracy of the VAR methodology is reviewed
by backtesting (i.e., comparing actual results against expectations
derived from historical data) the VAR results against the daily profit and
loss. Graphic representation of the backtesting results with additional
explanation of backtesting excesses are reported to the GRC. Backtesting
excesses occur when trading losses exceed the VAR. Senior management
reviews and evaluates the results of these tests.
The following graph shows daily trading-related revenue and VAR for
the 12 months ended December 31, 2008. Actual losses exceeded daily
trading VAR two times in the 12 months ended December 31, 2008 and
excluding any discrete writedowns on CDOs losses exceeded daily trading
VAR 14 times in the 12 months ended December 31, 2007. During the
12 months ended December 31, 2008, we continued to take writedowns
on our CDO exposure, but revalued these positions on a more regular
basis, and therefore no CDO-related losses were excluded from the follow-
ing graph. Our increase in total trading VAR during the fourth quarter
resulted from sharply increased volatility in the markets and widening
credit spreads across all rating categories, despite establishing a lower
risk profile, as discussed in stress testing below. Our VAR methodology
for credit products produces VAR measures that increase in proportion to
the level of credit spreads. The large widening in credit spreads during
the fourth quarter produced commensurately large increases and fluctua-
tions in VAR. As a result, the majority of the highs for VAR in 2008
occurred during the fourth quarter. In periods of market stress, the GRC
members communicate daily to discuss losses and VAR limit excesses.
As a result of this process, the lines of business may selectively reduce
risk. Where economically feasible, positions are sold or macro economic
hedges are executed to reduce the exposure.
86
Bank of America 2008