Bank of America 2008 Annual Report Download - page 27
Download and view the complete annual report
Please find page 27 of the 2008 Bank of America annual report below. You can navigate through the pages in the report by either clicking on the pages listed below, or by using the keyword search tool below to find specific information within the annual report.-
 1
1 -
2
-
3
-
4
-
5
-
6
-
7
-
8
-
9
-
10
-
11
-
12
-
13
-
14
-
15
-
16
-
 17
17 -
 18
18 -
 19
19 -
 20
20 -
 21
21 -
 22
22 -
 23
23 -
 24
24 -
 25
25 -
 26
26 -
 27
27 -
 28
28 -
 29
29 -
 30
30 -
 31
31 -
 32
32 -
 33
33 -
 34
34 -
 35
35 -
 36
36 -
 37
37 -
38
-
39
-
40
-
41
-
42
-
43
-
44
-
45
-
46
-
47
-
48
-
49
-
50
-
51
-
52
-
53
-
54
-
55
-
56
-
57
-
58
-
59
-
60
-
61
-
62
-
63
-
64
-
65
-
66
-
67
-
68
-
69
-
70
-
71
-
72
-
73
-
74
-
75
-
76
-
77
-
78
-
79
-
80
-
81
-
82
-
83
-
84
-
85
-
86
-
87
-
88
-
89
-
90
-
91
-
92
-
93
-
94
-
95
-
96
-
97
-
98
-
99
-
100
-
101
-
102
-
103
-
104
-
105
-
106
-
107
-
108
-
109
-
110
-
111
-
112
-
113
-
114
-
115
-
116
-
117
-
118
-
119
-
120
-
121
-
122
-
123
-
124
-
125
-
126
-
127
-
128
-
129
-
130
-
131
-
132
-
133
-
134
-
135
-
136
-
137
-
138
-
139
-
140
-
141
-
142
-
143
-
144
-
145
-
146
-
147
-
148
-
149
-
150
-
151
-
152
-
153
-
154
-
155
-
156
-
157
-
158
-
159
-
160
-
161
-
162
-
163
-
164
-
165
-
166
-
167
-
168
-
169
-
170
-
171
-
172
-
173
-
174
-
175
-
176
-
177
-
178
-
179
-
180
-
181
-
182
-
183
-
184
-
185
-
186
-
187
-
188
-
189
-
190
-
191
-
192
-
193
-
194
-
195
 |
 |

markets, partially offset by the full year impact of the U.S. Trust Corpo-
ration and LaSalle acquisitions.
ŠInvestment banking income decreased $82 million due to reduced
advisory fees related to the slowing economy.
ŠEquity investment income decreased $3.5 billion due to a reduction in
gains from our Principal Investing portfolio attributable to the lack of
liquidity in the marketplace when compared to 2007 and other-than-
temporary impairments taken on certain AFS marketable equity secu-
rities.
ŠTrading account losses were $5.9 billion in 2008 driven by losses
related to CDO exposure and the continuing impact of the market dis-
ruptions on various parts of the CMAS business. Contributing to these
losses were severe volatility, illiquidity and credit dislocations in the
debt and equity markets during the fourth quarter of 2008. For more
information, see the GCIB discussion beginning on page 38.
ŠMortgage banking income increased $3.2 billion in large part as a
result of the Countrywide acquisition which contributed significantly to
increases in servicing income of $1.7 billion and production income of
$1.5 billion.
ŠInsurance premiums increased $1.1 billion primarily due to the acquis-
ition of Countrywide.
ŠGains on sales of debt securities increased $944 million driven by the
sales of mortgage-backed securities and collateralized mortgage obliga-
tions.
ŠOther income decreased $6.0 billion due to CMAS related writedowns
(e.g., CDO exposure, leveraged finance loans and CMBS) of $5.3 bil-
lion and $1.1 billion of losses associated with the support provided to
certain cash funds managed within GWIM. In addition, 2008 was
impacted by the absence of the $1.5 billion gain from the sale of
Marsico recognized in 2007. Partially offsetting these items was the
gain of $776 million related to the Visa IPO. For more information on
the CMAS related writedowns, see page 40.
Provision for Credit Losses
The provision for credit losses increased $18.4 billion to $26.8 billion for
2008 compared to 2007 due to higher net charge-offs and additions to
the reserve. The majority of the reserve additions were in consumer and
small business portfolios, reflective of continued weakness in the hous-
ing markets and the slowing economy. Reserves were also increased on
commercial portfolios for deterioration in the homebuilder and non-real
estate commercial portfolios within GCIB. For further discussion, see
Provision for Credit Losses on page 81.
Noninterest Expense
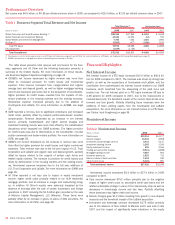
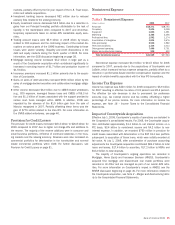
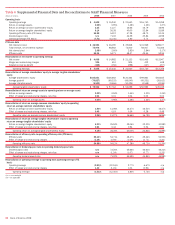
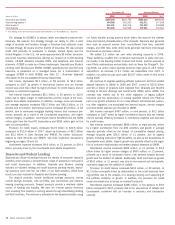
Table 3 Noninterest Expense
(Dollars in millions) 2008 2007
Personnel
$18,371
$18,753
Occupancy
3,626
3,038
Equipment
1,655
1,391
Marketing
2,368
2,356
Professional fees
1,592
1,174
Amortization of intangibles
1,834
1,676
Data processing
2,546
1,962
Telecommunications
1,106
1,013
Other general operating
7,496
5,751
Merger and restructuring charges
935
410
Total noninterest expense
$41,529
$37,524
Noninterest expense increased $4.0 billion to $41.5 billion for 2008
compared to 2007, primarily due to the acquisitions of Countrywide and
LaSalle, which increased various expense categories, partially offset by a
reduction in performance-based incentive compensation expense and the
impact of certain benefits associated with the Visa IPO transactions.
Income Tax Expense
Income tax expense was $420 million for 2008 compared to $5.9 billion
for 2007 resulting in effective tax rates of 9.5 percent and 28.4 percent.
The effective tax rate decrease is due to permanent tax preference
amounts (e.g., tax exempt income and tax credits) offsetting a higher
percentage of our pre-tax income. For more information on income tax
expense, see Note 18 – Income Taxes to the Consolidated Financial
Statements.
Impact of Countrywide Acquisition
Effective July 1, 2008, Countrywide’s results of operations are included in
the Corporation’s consolidated results. For 2008, the Countrywide acquis-
ition contributed approximately $1.3 billion to net interest income on a
FTE basis, $3.4 billion to noninterest income and $4.2 billion to non-
interest expense. In addition, we recorded $750 million in provision for
credit losses associated with deterioration in the SOP 03-3 loan portfolio
subsequent to acquisition of these loans, which were initially recorded at
fair value. At July 1, 2008, after consideration of purchase accounting
adjustments the Countrywide acquisition contributed $86.2 billion to total
loans and leases, $17.4 billion to securities, $17.2 billion to MSRs and
$63.0 billion to total deposits.
The majority of Countrywide’s ongoing operations are recorded in
Mortgage, Home Equity and Insurance Services (MHEIS). Countrywide’s
acquired first mortgage and discontinued real estate portfolios were
recorded in All Other and are managed as part of our overall ALM activ-
ities. For more information on Countrywide’s impact in MHEIS, see the
MHEIS discussion beginning on page 36. For more information related to
the Countrywide acquisition, see Note 2 – Merger and Restructuring Activ-
ity to the Consolidated Financial Statements.
Bank of America 2008
25