Bank of America 2008 Annual Report Download - page 110
Download and view the complete annual report
Please find page 110 of the 2008 Bank of America annual report below. You can navigate through the pages in the report by either clicking on the pages listed below, or by using the keyword search tool below to find specific information within the annual report.-
 1
1 -
2
-
3
-
4
-
5
-
6
-
7
-
8
-
9
-
10
-
11
-
12
-
13
-
14
-
15
-
16
-
17
-
18
-
19
-
20
-
21
-
22
-
23
-
24
-
25
-
26
-
27
-
28
-
29
-
30
-
31
-
32
-
33
-
34
-
35
-
36
-
37
-
38
-
39
-
40
-
41
-
42
-
43
-
44
-
45
-
46
-
47
-
48
-
49
-
50
-
51
-
52
-
53
-
54
-
55
-
56
-
57
-
58
-
59
-
60
-
61
-
62
-
63
-
64
-
65
-
66
-
67
-
68
-
69
-
70
-
71
-
72
-
73
-
74
-
75
-
76
-
77
-
78
-
79
-
80
-
81
-
82
-
83
-
84
-
85
-
86
-
87
-
88
-
89
-
90
-
91
-
92
-
93
-
94
-
95
-
96
-
97
-
98
-
99
-
 100
100 -
 101
101 -
 102
102 -
 103
103 -
 104
104 -
 105
105 -
 106
106 -
 107
107 -
 108
108 -
 109
109 -
 110
110 -
 111
111 -
 112
112 -
 113
113 -
 114
114 -
 115
115 -
 116
116 -
 117
117 -
 118
118 -
 119
119 -
 120
120 -
121
-
122
-
123
-
124
-
125
-
126
-
127
-
128
-
129
-
130
-
131
-
132
-
133
-
134
-
135
-
136
-
137
-
138
-
139
-
140
-
141
-
142
-
143
-
144
-
145
-
146
-
147
-
148
-
149
-
150
-
151
-
152
-
153
-
154
-
155
-
156
-
157
-
158
-
159
-
160
-
161
-
162
-
163
-
164
-
165
-
166
-
167
-
168
-
169
-
170
-
171
-
172
-
173
-
174
-
175
-
176
-
177
-
178
-
179
-
180
-
181
-
182
-
183
-
184
-
185
-
186
-
187
-
188
-
189
-
190
-
191
-
192
-
193
-
194
-
195
 |
 |

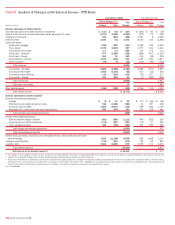
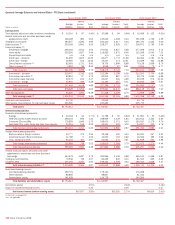
Table XII Selected Quarterly Financial Data
2008 Quarters 2007 Quarters
(Dollars in millions, except per share information) Fourth Third Second First Fourth Third Second First
Income statement
Net interest income
$ 13,106
$ 11,642 $ 10,621 $ 9,991 $ 9,165 $ 8,617 $ 8,389 $ 8,270
Noninterest income
2,574
7,979 9,789 7,080 3,639 7,480 11,281 9,992
Total revenue, net of interest expense
15,680
19,621 20,410 17,071 12,804 16,097 19,670 18,262
Provision for credit losses
8,535
6,450 5,830 6,010 3,310 2,030 1,810 1,235
Noninterest expense, before merger
and restructuring charges
10,641
11,413 9,447 9,093 10,269 8,627 9,125 9,093
Merger and restructuring charges
306
247 212 170 140 84 75 111
Income (loss) before income taxes
(3,802)
1,511 4,921 1,798 (915) 5,356 8,660 7,823
Income tax expense (benefit)
(2,013)
334 1,511 588 (1,183) 1,658 2,899 2,568
Net income (loss)
$ (1,789)
$ 1,177 $ 3,410 $ 1,210 $ 268 $ 3,698 $ 5,761 $ 5,255
Average common shares issued and
outstanding (in thousands)
4,957,049
4,543,963 4,435,719 4,427,823 4,421,554 4,420,616 4,419,246 4,432,664
Average diluted common shares issued
and outstanding (in thousands)
4,957,049
4,563,508 4,457,193 4,461,201 4,470,108 4,475,917 4,476,799 4,497,028
Performance ratios
Return on average assets
(0.37)%
0.25 % 0.78 % 0.28 % 0.06 % 0.93 % 1.48 % 1.40 %
Return on average common
shareholders’ equity
(6.68)
1.97 9.25 2.90 0.60 11.02 17.55 16.16
Return on average tangible
shareholders’ equity
(1)
(8.28)
6.24 18.54 7.26 1.90 25.58 39.22 36.29
Total ending equity to total ending assets
9.74
8.79 9.48 9.00 8.56 8.77 8.85 8.98
Total average equity to total average
assets
9.06
8.73 9.20 8.77 8.32 8.51 8.55 8.78
Dividend payout
n/m
n/m 88.67 n/m n/m 77.97 43.60 48.02
Per common share data
Earnings (loss)
$ (0.48)
$ 0.15 $ 0.73 $ 0.23 $ 0.05 $ 0.83 $ 1.29 $ 1.18
Diluted earnings (loss)
(0.48)
0.15 0.72 0.23 0.05 0.82 1.28 1.16
Dividends paid
0.32
0.64 0.64 0.64 0.64 0.64 0.56 0.56
Book value
27.77
30.01 31.11 31.22 32.09 30.45 29.95 29.74
Market price per share of common stock
Closing
$ 14.08
$ 35.00 $ 23.87 $ 37.91 $ 41.26 $ 50.27 $ 48.89 $ 51.02
High closing
38.13
37.48 40.86 45.03 52.71 51.87 51.82 54.05
Low closing
11.25
18.52 23.87 35.31 41.10 47.00 48.80 49.46
Market capitalization
$ 70,645
$ 159,672 $ 106,292 $ 168,806 $ 183,107 $ 223,041 $ 216,922 $ 226,481
Average balance sheet
Total loans and leases
$ 941,563
$ 946,914 $ 878,639 $ 875,661 $ 868,119 $ 780,516 $ 740,199 $ 714,042
Total assets
1,948,854
1,905,691 1,754,613 1,764,927 1,742,467 1,580,565 1,561,649 1,521,418
Total deposits
892,141
857,845 786,002 787,623 781,625 702,481 697,035 686,704
Long-term debt
255,709
264,934 205,194 198,463 196,444 175,265 158,500 148,627
Common shareholders’ equity
142,535
142,303 140,243 141,456 141,085 131,606 130,700 130,737
Total shareholders’ equity
176,566
166,454 161,428 154,728 144,924 134,487 133,551 133,588
Asset quality (2)
Allowance for credit losses
(3)
$ 23,492
$ 20,773 $ 17,637 $ 15,398 $ 12,106 $ 9,927 $ 9,436 $ 9,106
Nonperforming assets
(4)
18,232
13,576 9,749 7,827 5,948 3,372 2,392 2,059
Allowance for loan and lease losses as
a percentage of total loans and
leases outstanding
(5)
2.49 %
2.17 % 1.98 % 1.71 % 1.33 % 1.21 % 1.20 % 1.21 %
Allowance for loan and lease losses as
a percentage of total nonperforming
loans and leases
(5)
141
173 187 203 207 300 397 443
Net charge-offs
$ 5,541
$ 4,356 $ 3,619 $ 2,715 $ 1,985 $ 1,573 $ 1,495 $ 1,427
Annualized net charge-offs as a
percentage of average loans and
leases outstanding
(5)
2.36 %
1.84 % 1.67 % 1.25 % 0.91 % 0.80 % 0.81 % 0.81 %
Nonperforming loans and leases as a
percentage of total loans and leases
outstanding
(5)
1.77
1.25 1.06 0.84 0.64 0.40 0.30 0.27
Nonperforming assets as a percentage
of total loans, leases and foreclosed
properties
(4, 5)
1.96
1.45 1.13 0.90 0.68 0.43 0.32 0.29
Ratio of the allowance for loan and
lease losses at period end to
annualized net charge-offs
1.05
1.17 1.18 1.36 1.47 1.53 1.51 1.51
Capital ratios (period end)
Risk-based capital:
Tier 1
9.15 %
7.55 % 8.25 % 7.51 % 6.87 % 8.22 % 8.52 % 8.57 %
Total
13.00
11.54 12.60 11.71 11.02 11.86 12.11 11.94
Tier 1 Leverage
6.44
5.51 6.07 5.59 5.04 6.20 6.33 6.25
(1) Tangible shareholders’ equity is a non-GAAP measure. For additional information on ROTE and a corresponding reconciliation of tangible shareholders’ equity to a GAAP financial measure, see Supplemental Financial
Data beginning on page 29.
(2) We account for acquired impaired loans in accordance with SOP 03-3. For more information on the impact of SOP 03-3 on asset quality, see Consumer Portfolio Credit Risk Management beginning on page 62.
(3) Includes the allowance for loan and lease losses, and the reserve for unfunded lending commitments.
(4) Balances and ratios do not include nonperforming LHFS and nonperforming AFS debt securities.
(5) Balances and ratios do not include loans measured at fair value in accordance with SFAS 159.
n/m = not meaningful
108
Bank of America 2008