Philips 2010 Annual Report Download - page 114
Download and view the complete annual report
Please find page 114 of the 2010 Philips annual report below. You can navigate through the pages in the report by either clicking on the pages listed below, or by using the keyword search tool below to find specific information within the annual report.-
 1
1 -
2
-
3
-
4
-
5
-
6
-
7
-
8
-
9
-
10
-
11
-
12
-
13
-
14
-
15
-
16
-
17
-
18
-
19
-
20
-
21
-
22
-
23
-
24
-
25
-
26
-
27
-
28
-
29
-
30
-
31
-
32
-
33
-
34
-
35
-
36
-
37
-
38
-
39
-
40
-
41
-
42
-
43
-
44
-
45
-
46
-
47
-
48
-
49
-
50
-
51
-
52
-
53
-
54
-
55
-
56
-
57
-
58
-
59
-
60
-
61
-
62
-
63
-
64
-
65
-
66
-
67
-
68
-
69
-
70
-
71
-
72
-
73
-
74
-
75
-
76
-
77
-
78
-
79
-
80
-
81
-
82
-
83
-
84
-
85
-
86
-
87
-
88
-
89
-
90
-
91
-
92
-
93
-
94
-
95
-
96
-
97
-
98
-
99
-
100
-
101
-
102
-
103
-
 104
104 -
 105
105 -
 106
106 -
 107
107 -
 108
108 -
 109
109 -
 110
110 -
 111
111 -
 112
112 -
 113
113 -
 114
114 -
 115
115 -
 116
116 -
 117
117 -
 118
118 -
 119
119 -
 120
120 -
 121
121 -
 122
122 -
 123
123 -
 124
124 -
125
-
126
-
127
-
128
-
129
-
130
-
131
-
132
-
133
-
134
-
135
-
136
-
137
-
138
-
139
-
140
-
141
-
142
-
143
-
144
-
145
-
146
-
147
-
148
-
149
-
150
-
151
-
152
-
153
-
154
-
155
-
156
-
157
-
158
-
159
-
160
-
161
-
162
-
163
-
164
-
165
-
166
-
167
-
168
-
169
-
170
-
171
-
172
-
173
-
174
-
175
-
176
-
177
-
178
-
179
-
180
-
181
-
182
-
183
-
184
-
185
-
186
-
187
-
188
-
189
-
190
-
191
-
192
-
193
-
194
-
195
-
196
-
197
-
198
-
199
-
200
-
201
-
202
-
203
-
204
-
205
-
206
-
207
-
208
-
209
-
210
-
211
-
212
-
213
-
214
-
215
-
216
-
217
-
218
-
219
-
220
-
221
-
222
-
223
-
224
-
225
-
226
-
227
-
228
-
229
-
230
-
231
-
232
-
233
-
234
-
235
-
236
-
237
-
238
-
239
-
240
-
241
-
242
-
243
-
244
-
245
-
246
-
247
-
248
-
249
-
250
 |
 |

7 Risk management 7.6 - 7.6
114 Annual Report 2010
pension costs (NPPC) of Philips’ pension plans. The
pension plans in the Netherlands, the UK, the US and
Germany cover approximately 95% of the Philips’ total
pension liabilities. To monitor their exposure to the
respective risk factors, Philips periodically performs
sensitivity analysis of the pension accounting figures. The
sensitivity analysis presented and described here is solely
based on accounting figures and does not cover funded
status or pension cost analysis on an economic or a plan-
specific regulatory basis.
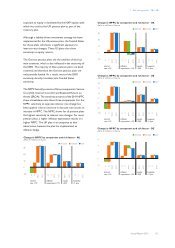
Sensitivity analysis
An appropriate overview of Philips’ pension risk
exposures can be obtained by a sensitivity analysis of the
Funded Status and NPPC for the above mentioned
pension plans. The bar charts in the next eight graphs
show the sensitivity of the Funded Status and NPPC to
changes in interest rates, inflation expectations, equity
price levels and longevity. The changes applied in this
analysis represent approximately one annual standard
deviation, which is based on long-term historical time-
series; except for longevity, where one year is added to
the average life expectancy. The size of the changes of
each of the respective risk factors, which are used in the
analysis, are shown in the graphs. The graphs show how
much the Funded Status and NPPC change relative to
their year-end 2010 levels, if equity price levels, interest
rates, inflation expectations and longevity trends deviate
from the year-end position.
The sensitivity of the DBO for the Dutch pension plan is
dominated by interest rate sensitivity. The liability hedging
strategy of the Dutch Pension Plan significantly reduces
the interest rate exposure of the Funded Status. Highest
sensitivity of the Funded Status of the Dutch plan is caused
by changes in inflation expectation.
800 (800)
(150)
(500)
350 (350)
(500)
1400
1550
0
(250)
(500)
1750
750
1000
1250
1500
500
250
DBO, MVA and Funded Status sensitivity - NL
delta in millions of euros
delta MVA delta Funded Statusdelta DBO
325
75 400
(150)
100 (100)
(150)
500
475
25
0
(100)
(200)
500
400
300
200
100
DBO, MVA and Funded Status sensitivity - UK
delta in millions of euros
delta MVA delta Funded Statusdelta DBO
25 (25)
325 (175)
(125)
75 (75)
(125)
150
0
(100)
(200)
400
300
200
100
DBO, MVA and Funded Status sensitivity - US
delta in millions of euros
delta MVA delta Funded Statusdelta DBO
(15)
25 (25)
(15)
90
20
(70)
15
70 (55)
0
(20)
100
80
60
40
20
DBO, MVA and Funded Status sensitivity - DE
delta in millions of euros
delta MVA delta Funded Statusdelta DBO
The Dutch pension plan has maintained a strategic
allocation to global equity markets. As a result the Funded
Status of the Dutch plan is sensitive to changes in equity
prices.
For the UK pension plan, the interest rate and inflation
expectation sensitivity of the Funded Status is opposite to
the sensitivity in the other countries. This is a result of the
liability hedging strategy adopted by the plan, which
matches the sensitivities of the pension liabilities on a local
valuation basis instead of the accounting basis. The