Philips 2010 Annual Report Download - page 213
Download and view the complete annual report
Please find page 213 of the 2010 Philips annual report below. You can navigate through the pages in the report by either clicking on the pages listed below, or by using the keyword search tool below to find specific information within the annual report.-
 1
1 -
2
-
3
-
4
-
5
-
6
-
7
-
8
-
9
-
10
-
11
-
12
-
13
-
14
-
15
-
16
-
17
-
18
-
19
-
20
-
21
-
22
-
23
-
24
-
25
-
26
-
27
-
28
-
29
-
30
-
31
-
32
-
33
-
34
-
35
-
36
-
37
-
38
-
39
-
40
-
41
-
42
-
43
-
44
-
45
-
46
-
47
-
48
-
49
-
50
-
51
-
52
-
53
-
54
-
55
-
56
-
57
-
58
-
59
-
60
-
61
-
62
-
63
-
64
-
65
-
66
-
67
-
68
-
69
-
70
-
71
-
72
-
73
-
74
-
75
-
76
-
77
-
78
-
79
-
80
-
81
-
82
-
83
-
84
-
85
-
86
-
87
-
88
-
89
-
90
-
91
-
92
-
93
-
94
-
95
-
96
-
97
-
98
-
99
-
100
-
101
-
102
-
103
-
104
-
105
-
106
-
107
-
108
-
109
-
110
-
111
-
112
-
113
-
114
-
115
-
116
-
117
-
118
-
119
-
120
-
121
-
122
-
123
-
124
-
125
-
126
-
127
-
128
-
129
-
130
-
131
-
132
-
133
-
134
-
135
-
136
-
137
-
138
-
139
-
140
-
141
-
142
-
143
-
144
-
145
-
146
-
147
-
148
-
149
-
150
-
151
-
152
-
153
-
154
-
155
-
156
-
157
-
158
-
159
-
160
-
161
-
162
-
163
-
164
-
165
-
166
-
167
-
168
-
169
-
170
-
171
-
172
-
173
-
174
-
175
-
176
-
177
-
178
-
179
-
180
-
181
-
182
-
183
-
184
-
185
-
186
-
187
-
188
-
189
-
190
-
191
-
192
-
193
-
194
-
195
-
196
-
197
-
198
-
199
-
200
-
201
-
202
-
 203
203 -
 204
204 -
 205
205 -
 206
206 -
 207
207 -
 208
208 -
 209
209 -
 210
210 -
 211
211 -
 212
212 -
 213
213 -
 214
214 -
 215
215 -
 216
216 -
 217
217 -
 218
218 -
 219
219 -
 220
220 -
 221
221 -
 222
222 -
 223
223 -
224
-
225
-
226
-
227
-
228
-
229
-
230
-
231
-
232
-
233
-
234
-
235
-
236
-
237
-
238
-
239
-
240
-
241
-
242
-
243
-
244
-
245
-
246
-
247
-
248
-
249
-
250
 |
 |

15 Sustainability statements 15.4 - 15.4
Annual Report 2010 213
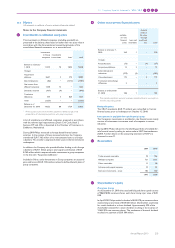
Green Manufacturing 20151)
parameters
unit of measurement 2015 reduction target
(%) 2010 actual reduction
(%)
Total CO2 from manufacturing CO2-equivalent tons 25 8
Water m3 10 −
Materials provided for recycling via external contractor per total waste % 80 78
Restricted substances:
Benzene emission kg 50 (95)
Mercury emission kg 100 55
CFCs, HCFCs kg 100 97
Other restricted substances (excluding CFCs from cooling systems) kg 90 13
Hazardous substances:
Lead emission kg 100 94
PFCs kg 35 2
Toluene emission kg 90 (199)
Xylene emission kg 90 (578)
Styrene kg 90 72
Antimony, Arsenic and their compounds kg 100 (33)
1) Total reduction targets in absolute terms against the base year 2007
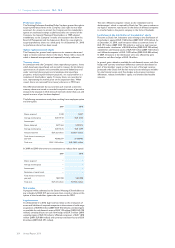
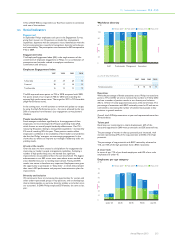
Energy use in manufacturing
Total energy usage in manufacturing amounted to 14,232 terajoules in
2010. Compared with 2009, energy consumption at Philips Group level
remained even. This was driven by production volume increases in
Lighting, representing about 80% of the Philips energy usage, mitigated
by energy efficiency improvement measures and by the changing
industrial footprint. Energy consumption at Consumer Lifestyle
increased 7%, mainly as a result of the inclusion of a new acquisition.
Total energy consumption in manufacturing
in terajoules
2007 2008 2009 2010
Healthcare 1,602 1,612 1,669 1,537
Consumer Lifestyle 1,451 1,521 1,186 1,272
Lighting 12,119 11,435 11,411 11,396
Group Management & Services 35 34 28 27
Philips Group 15,207 14,602 14,294 14,232
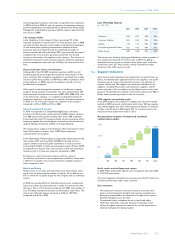
Carbon emissions in manufacturing
Greenhouse gas emissions of our manufacturing operations totaled 668
kilotons CO2-equivalent in 2010, 18% lower than 2009. Direct CO2
emissions related to energy use increased slightly mainly as a result of
higher volumes of natural gas based production at Lighting, while
indirect CO2 emissions decreased 29% as we increased the share of
electricity generated by renewable sources.
Total carbon emissions in manufacturing
in kilotons CO2-equivalent
2007 2008 2009 2010
Direct CO21) 324 304 287 290
Indirect CO2470 430 451 320
Other greenhouse gases 41 61 54 33
From glass production 29 28 24 25
Total 864 823 816 668
1) From energy
CO2 emissions decreased at all sectors due to energy efficiency
improvements and an increased share of electricity generated by
renewable sources. Healthcare achieved additional reductions in CO2
emissions due to changes in the industrial footprint.
Total carbon emissions in manufacturing per sector
in kilotons CO2-equivalent
2007 2008 2009 2010
Healthcare 118 120 122 64
Consumer Lifestyle 65 65 50 44
Lighting 679 636 643 559
Group Management & Services 2 2 1 1
Philips Group 864 823 816 668
Water usage in manufacturing
In Lighting (representing about 85% of total water usage), water is used
in manufacturing as well as for domestic purpose. The other sectors
mainly use water for domestic purposes. Total water intake in 2010 was
4.2 million m3, on par with 2009. Within the sectors there is a decrease
in water usage in Healthcare, and an increase in Consumer Lifestyle due
to changes in the industrial footprint.