Philips 2010 Annual Report Download - page 63
Download and view the complete annual report
Please find page 63 of the 2010 Philips annual report below. You can navigate through the pages in the report by either clicking on the pages listed below, or by using the keyword search tool below to find specific information within the annual report.-
 1
1 -
2
-
3
-
4
-
5
-
6
-
7
-
8
-
9
-
10
-
11
-
12
-
13
-
14
-
15
-
16
-
17
-
18
-
19
-
20
-
21
-
22
-
23
-
24
-
25
-
26
-
27
-
28
-
29
-
30
-
31
-
32
-
33
-
34
-
35
-
36
-
37
-
38
-
39
-
40
-
41
-
42
-
43
-
44
-
45
-
46
-
47
-
48
-
49
-
50
-
51
-
52
-
 53
53 -
 54
54 -
 55
55 -
 56
56 -
 57
57 -
 58
58 -
 59
59 -
 60
60 -
 61
61 -
 62
62 -
 63
63 -
 64
64 -
 65
65 -
 66
66 -
 67
67 -
 68
68 -
 69
69 -
 70
70 -
 71
71 -
 72
72 -
 73
73 -
74
-
75
-
76
-
77
-
78
-
79
-
80
-
81
-
82
-
83
-
84
-
85
-
86
-
87
-
88
-
89
-
90
-
91
-
92
-
93
-
94
-
95
-
96
-
97
-
98
-
99
-
100
-
101
-
102
-
103
-
104
-
105
-
106
-
107
-
108
-
109
-
110
-
111
-
112
-
113
-
114
-
115
-
116
-
117
-
118
-
119
-
120
-
121
-
122
-
123
-
124
-
125
-
126
-
127
-
128
-
129
-
130
-
131
-
132
-
133
-
134
-
135
-
136
-
137
-
138
-
139
-
140
-
141
-
142
-
143
-
144
-
145
-
146
-
147
-
148
-
149
-
150
-
151
-
152
-
153
-
154
-
155
-
156
-
157
-
158
-
159
-
160
-
161
-
162
-
163
-
164
-
165
-
166
-
167
-
168
-
169
-
170
-
171
-
172
-
173
-
174
-
175
-
176
-
177
-
178
-
179
-
180
-
181
-
182
-
183
-
184
-
185
-
186
-
187
-
188
-
189
-
190
-
191
-
192
-
193
-
194
-
195
-
196
-
197
-
198
-
199
-
200
-
201
-
202
-
203
-
204
-
205
-
206
-
207
-
208
-
209
-
210
-
211
-
212
-
213
-
214
-
215
-
216
-
217
-
218
-
219
-
220
-
221
-
222
-
223
-
224
-
225
-
226
-
227
-
228
-
229
-
230
-
231
-
232
-
233
-
234
-
235
-
236
-
237
-
238
-
239
-
240
-
241
-
242
-
243
-
244
-
245
-
246
-
247
-
248
-
249
-
250
 |
 |

5 Group performance 5.1.5 - 5.1.10
Annual Report 2010 63
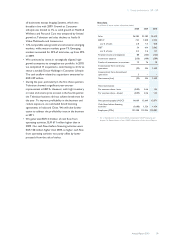
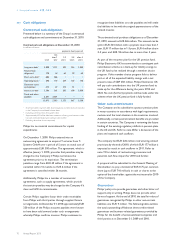
Value adjustments on securities
in millions of euros
2008 2009 2010
NXP (599) (48) −
LG Display (448) − −
TPO Display (71) − −
Pace Micro Technology (30) − −
Prime Technology − (6) (2)
Other − (4) −
(1,148) (58) (2)
2009 was impacted by impairment charges amounting to
EUR 58 million, mainly from shareholdings in NXP.
Other financial expenses amounted to a EUR 57 million
expense in 2010, compared to EUR 18 million income in
2009. 2010 primarily consisted of a EUR 21 million loss
related to the revaluation of the convertible bonds
received from TPV Technology and CBaySystems
Holdings (CBAY), and a EUR 20 million accretion expense
mainly associated with discounted provisions.
Other financial expenses in 2009 primarily consisted of a
EUR 19 million gain related to the revaluation of the
convertible bonds received from TPV Technology and
CBAY, and dividend income totaling EUR 16 million, EUR
12 million of which related to holdings in LG Display.
Other financial expenses included EUR 15 million
accretion expenses, mainly associated with discounted
asbestos provisions.
For further information, refer to note 2.
5.1.6 Income taxes
Income taxes amounted to EUR 509 million, compared to
EUR 100 million in 2009. The year-on-year increase was
largely attributable to higher taxable earnings.
The tax burden in 2010 corresponded to an effective tax
rate of 26.2%, compared to 22.3% in 2009. The increase in
the effective tax rate was attributable to a change in the
country mix of income tax rates and a change in the mix of
profits and losses in the various countries, as well as
2009’s recognition of a deferred tax asset for Lumileds
previously not recognized. This was partly offset by a
number of tax settlements.
For 2011, the effective tax rate excluding incidental non-
taxable items is expected to be between 30% and 32%.
For further information, refer to note 3.
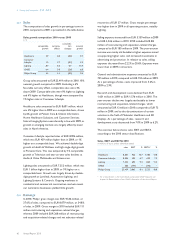
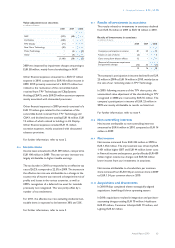
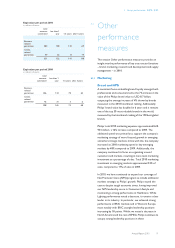
5.1.7 Results of investments in associates
The results related to investments in associates declined
from EUR 76 million in 2009 to EUR 18 million in 2010.
Results of investments in associates
in millions of euros
2008 2009 2010
Company’s participation in income 81 23 14
Results on sale of shares (2) − 5
Gains arising from dilution effects 12 − −
(Reversal of) investment impairment
and guarantee charges (72) 53 (1)
19 76 18
The company’s participation in income declined from EUR
23 million in 2009 to EUR 14 million in 2010, mainly due to
the sale of our remaining stake in TPV Technology.
In 2009, following recovery of the TPV share price, the
accumulated value adjustment of the shareholding in TPV
recognized in 2008 was reversed by EUR 55 million. The
company’s participation in income of EUR 23 million in
2009 was mainly attributable to results on Intertrust.
For further information, refer to note 4.
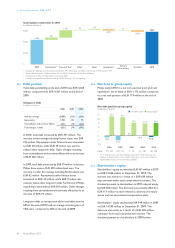
5.1.8 Non-controlling interests
Net income attributable to non-controlling interests
amounted to EUR 6 million in 2010, compared to EUR 14
million in 2009.
5.1.9 Net income
Net income increased from EUR 424 million in 2009 to
EUR 1,452 million. The improvement was driven by EUR
1,451 million higher EBIT and EUR 44 million lower costs
in Financial income and expenses, partly offset by EUR 409
million higher income tax charges and EUR 58 million
lower income from our investments in associates.
Net income attributable to shareholders per common
share increased from EUR 0.44 per common share in 2009
to EUR 1.54 per common share in 2010.
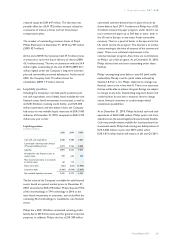
5.1.10 Acquisitions and divestments
In 2010 Philips completed eleven strategically-aligned
acquisitions, benefiting all three operating sectors.
In 2010, acquisitions resulted in integration and purchase-
accounting charges totaling EUR 70 million: Healthcare
EUR 29 million, Consumer Lifestyle EUR 19 million, and
Lighting EUR 22 million.