Philips 2010 Annual Report Download - page 195
Download and view the complete annual report
Please find page 195 of the 2010 Philips annual report below. You can navigate through the pages in the report by either clicking on the pages listed below, or by using the keyword search tool below to find specific information within the annual report.-
 1
1 -
2
-
3
-
4
-
5
-
6
-
7
-
8
-
9
-
10
-
11
-
12
-
13
-
14
-
15
-
16
-
17
-
18
-
19
-
20
-
21
-
22
-
23
-
24
-
25
-
26
-
27
-
28
-
29
-
30
-
31
-
32
-
33
-
34
-
35
-
36
-
37
-
38
-
39
-
40
-
41
-
42
-
43
-
44
-
45
-
46
-
47
-
48
-
49
-
50
-
51
-
52
-
53
-
54
-
55
-
56
-
57
-
58
-
59
-
60
-
61
-
62
-
63
-
64
-
65
-
66
-
67
-
68
-
69
-
70
-
71
-
72
-
73
-
74
-
75
-
76
-
77
-
78
-
79
-
80
-
81
-
82
-
83
-
84
-
85
-
86
-
87
-
88
-
89
-
90
-
91
-
92
-
93
-
94
-
95
-
96
-
97
-
98
-
99
-
100
-
101
-
102
-
103
-
104
-
105
-
106
-
107
-
108
-
109
-
110
-
111
-
112
-
113
-
114
-
115
-
116
-
117
-
118
-
119
-
120
-
121
-
122
-
123
-
124
-
125
-
126
-
127
-
128
-
129
-
130
-
131
-
132
-
133
-
134
-
135
-
136
-
137
-
138
-
139
-
140
-
141
-
142
-
143
-
144
-
145
-
146
-
147
-
148
-
149
-
150
-
151
-
152
-
153
-
154
-
155
-
156
-
157
-
158
-
159
-
160
-
161
-
162
-
163
-
164
-
165
-
166
-
167
-
168
-
169
-
170
-
171
-
172
-
173
-
174
-
175
-
176
-
177
-
178
-
179
-
180
-
181
-
182
-
183
-
184
-
 185
185 -
 186
186 -
 187
187 -
 188
188 -
 189
189 -
 190
190 -
 191
191 -
 192
192 -
 193
193 -
 194
194 -
 195
195 -
 196
196 -
 197
197 -
 198
198 -
 199
199 -
 200
200 -
 201
201 -
 202
202 -
 203
203 -
 204
204 -
 205
205 -
206
-
207
-
208
-
209
-
210
-
211
-
212
-
213
-
214
-
215
-
216
-
217
-
218
-
219
-
220
-
221
-
222
-
223
-
224
-
225
-
226
-
227
-
228
-
229
-
230
-
231
-
232
-
233
-
234
-
235
-
236
-
237
-
238
-
239
-
240
-
241
-
242
-
243
-
244
-
245
-
246
-
247
-
248
-
249
-
250
 |
 |

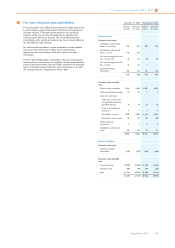
13 Group financial statements 13.11 - 13.11 32
Annual Report 2010 195
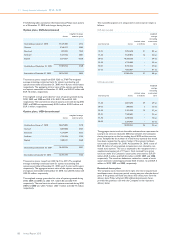
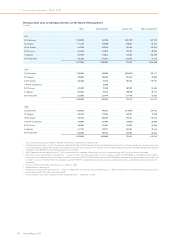
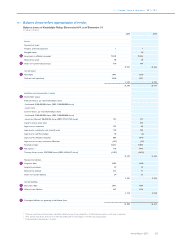
32 Fair value of financial assets and liabilities
The estimated fair value of financial instruments has been determined
by the Company using available market information and appropriate
valuation methods. The estimates presented are not necessarily
indicative of the amounts that will ultimately be realized by the
Company upon maturity or disposal. The use of different market
assumptions and/or estimation methods may have a material effect on
the estimated fair value amounts.
For cash and cash equivalents, current receivables, current payables,
interest accrual and short-term debts, the carrying amounts
approximate fair value, because of the short maturity of these
instruments.
The fair value of Philips debt is estimated on the basis of the quoted
market prices for certain issues, or on the basis of discounted cash flow
analysis based upon market rates plus Philips’ spread for the particular
tenors of the borrowing arrangement. Accrued interest is not within
the carrying amount or estimated fair value of debt.
December 31, 2009 December 31, 2010
carrying
amount estimated
fair value carrying
amount estimated
fair value
Financial assets
Carried at fair value:
Available-for-sale financial
assets - non-current 305 305 270 270
Available-for-sale financial
assets - current 145 145 − −
Fair value through profit and
loss - non-current 32 32 62 62
Fair value through profit and
loss - current 25 25 − −
Derivative financial
instruments 102 102 112 112
609 609 444 444
Carried at (amortized)
cost:
Cash and cash equivalents 4,386 4,386 5,833 5,833
Other current financial assets 21 21 5 5
Loans and receivables:
Other non-current loans
and receivables including
guarantee deposits 76 76 53 53
Loans to investments in
associates 7 7 3 3
Receivables - current 3,983 3,983 4,434 4,434
Receivables - non-current 85 85 88 88
Held-to-maturity
investments 2 2 2 2
Available-for-sale financial
assets 276 276 92 92
8,836 8,836 10,510 10,510
Financial liabilities
Carried at fair value:
Derivative financial
instruments (276) (276) (564) (564)
Carried at (amortized)
cost:
Accounts payable (2,870) (2,870) (3,691) (3,691)
Interest accrual (87) (87) (87) (87)
Debt (4,267) (4,556) (4,658) (5,156)
(7,224) (7,513) (8,436) (8,934)