Philips 2010 Annual Report Download - page 7
Download and view the complete annual report
Please find page 7 of the 2010 Philips annual report below. You can navigate through the pages in the report by either clicking on the pages listed below, or by using the keyword search tool below to find specific information within the annual report.-
 1
1 -
 2
2 -
 3
3 -
 4
4 -
 5
5 -
 6
6 -
 7
7 -
 8
8 -
 9
9 -
 10
10 -
 11
11 -
 12
12 -
 13
13 -
 14
14 -
 15
15 -
 16
16 -
 17
17 -
 18
18 -
19
-
20
-
21
-
22
-
23
-
24
-
25
-
26
-
27
-
28
-
29
-
30
-
31
-
32
-
33
-
34
-
35
-
36
-
37
-
38
-
39
-
40
-
41
-
42
-
43
-
44
-
45
-
46
-
47
-
48
-
49
-
50
-
51
-
52
-
53
-
54
-
55
-
56
-
57
-
58
-
59
-
60
-
61
-
62
-
63
-
64
-
65
-
66
-
67
-
68
-
69
-
70
-
71
-
72
-
73
-
74
-
75
-
76
-
77
-
78
-
79
-
80
-
81
-
82
-
83
-
84
-
85
-
86
-
87
-
88
-
89
-
90
-
91
-
92
-
93
-
94
-
95
-
96
-
97
-
98
-
99
-
100
-
101
-
102
-
103
-
104
-
105
-
106
-
107
-
108
-
109
-
110
-
111
-
112
-
113
-
114
-
115
-
116
-
117
-
118
-
119
-
120
-
121
-
122
-
123
-
124
-
125
-
126
-
127
-
128
-
129
-
130
-
131
-
132
-
133
-
134
-
135
-
136
-
137
-
138
-
139
-
140
-
141
-
142
-
143
-
144
-
145
-
146
-
147
-
148
-
149
-
150
-
151
-
152
-
153
-
154
-
155
-
156
-
157
-
158
-
159
-
160
-
161
-
162
-
163
-
164
-
165
-
166
-
167
-
168
-
169
-
170
-
171
-
172
-
173
-
174
-
175
-
176
-
177
-
178
-
179
-
180
-
181
-
182
-
183
-
184
-
185
-
186
-
187
-
188
-
189
-
190
-
191
-
192
-
193
-
194
-
195
-
196
-
197
-
198
-
199
-
200
-
201
-
202
-
203
-
204
-
205
-
206
-
207
-
208
-
209
-
210
-
211
-
212
-
213
-
214
-
215
-
216
-
217
-
218
-
219
-
220
-
221
-
222
-
223
-
224
-
225
-
226
-
227
-
228
-
229
-
230
-
231
-
232
-
233
-
234
-
235
-
236
-
237
-
238
-
239
-
240
-
241
-
242
-
243
-
244
-
245
-
246
-
247
-
248
-
249
-
250
 |
 |

President’s message
Annual Report 2010 7
energy efficiency of our product portfolio by 4% and
launched a series of programs to increase the recycled
content of our products. After achieving our EcoVision4
Green Product sales target of 30% last year, we achieved
our Green Innovation target in 2010, two years ahead of
schedule.
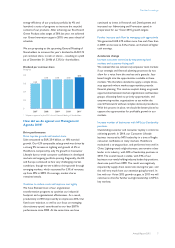
We are proposing to the upcoming General Meeting of
Shareholders to increase this year’s dividend to EUR 0.75
per common share, in cash or shares – resulting in a yield
(as of December 31, 2010) of 3.3% for shareholders.
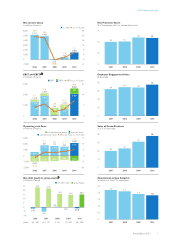
Dividend per common share
in euros
0.8
0.6
0.4
0.2
0
0.60
2007
0.70
2008
0.70
2009
0.70
2010
0.75
20111)
1) Subject to approval by the 2011 Annual General Meeting of Shareholders
How did we do against our Management
Agenda 2010?
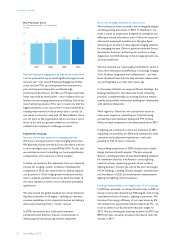
Drive performance
Drive top-line growth and market share
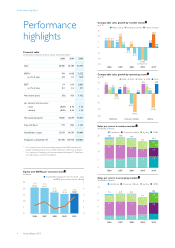
Sales amounted to EUR 25.4 billion, or 10% nominal
growth. Our 4.3% comparable sales growth was driven by
a strong 9% increase at Lighting and growth of 4% at
Healthcare, tempered by only 1% growth at Consumer
Lifestyle due to weak consumer confidence in developed
markets and ongoing portfolio pruning. Regionally, the US
and Europe continued to face very challenging market
conditions, though we were able to drive growth through
emerging markets, which accounted for 33% of revenues,
up from 30% in 2009. On average, market shares
remained steady.
Continue to reduce costs and improve cost agility
We have finalized most of our organization
transformation programs to optimize our industrial
footprint and organizational effectiveness. As a result,
productivity in 2010 improved by an impressive 20%. Our
fixed cost reduction, as well as our focus on managing
discretionary spend, contributed to our best EBITA
performance since 2000. At the same time, we have
continued to invest in Research and Development and
increased our Advertising and Promotion spend in
preparation for our Vision 2015 growth targets.
Further increase cash flow by managing cash aggressively
We generated EUR 470 million more free cash flow than
in 2009, an increase to 5.2% of sales, on the back of higher
cash earnings.
Accelerate change
Increase customer centricity by empowering local
markets and customer-facing staff
We realized that we cannot truly empower local markets
if our strategic and financial planning processes do not
allow for a voice from the market and a granular, fact-
based insight into the opportunities available in these
markets. We therefore decided to apply a simple three-
step approach where market opportunities precede
financial planning. This involves explicit dialog on growth
opportunities between market organizations and business
groups, allocating funds to priority opportunities, and
empowering market organizations to act within the
overall framework without complex decision procedures.
With this process in place, we should be better placed to
capture the opportunities for profitable growth in our
markets.
Increase number of businesses with NPS (co-) leadership
positions
Outstanding customer and consumer loyalty is critical to
achieving growth. In 2010, our Consumer Lifestyle
business increased its NPS leadership in a time of fragile
consumer confidence in many markets. Healthcare
maintained a strong position, and performed very well in
China. Lighting noted a slight decrease, yet remains a clear
leader in its industry, with 83% of leadership positions in
2010. The overall result is stable, with 59% of our
businesses currently holding industry leadership positions,
down one point from 2009. The result was negatively
impacted by supply chain constraints during the year, and
this will very much have our attention going forward. In
line with our Vision 2015 growth targets, in 2011 we will
continue to drive for further outright leadership in NPS in
key markets.