Philips 2010 Annual Report Download - page 58
Download and view the complete annual report
Please find page 58 of the 2010 Philips annual report below. You can navigate through the pages in the report by either clicking on the pages listed below, or by using the keyword search tool below to find specific information within the annual report.-
 1
1 -
2
-
3
-
4
-
5
-
6
-
7
-
8
-
9
-
10
-
11
-
12
-
13
-
14
-
15
-
16
-
17
-
18
-
19
-
20
-
21
-
22
-
23
-
24
-
25
-
26
-
27
-
28
-
29
-
30
-
31
-
32
-
33
-
34
-
35
-
36
-
37
-
38
-
39
-
40
-
41
-
42
-
43
-
44
-
45
-
46
-
47
-
 48
48 -
 49
49 -
 50
50 -
 51
51 -
 52
52 -
 53
53 -
 54
54 -
 55
55 -
 56
56 -
 57
57 -
 58
58 -
 59
59 -
 60
60 -
 61
61 -
 62
62 -
 63
63 -
 64
64 -
 65
65 -
 66
66 -
 67
67 -
 68
68 -
69
-
70
-
71
-
72
-
73
-
74
-
75
-
76
-
77
-
78
-
79
-
80
-
81
-
82
-
83
-
84
-
85
-
86
-
87
-
88
-
89
-
90
-
91
-
92
-
93
-
94
-
95
-
96
-
97
-
98
-
99
-
100
-
101
-
102
-
103
-
104
-
105
-
106
-
107
-
108
-
109
-
110
-
111
-
112
-
113
-
114
-
115
-
116
-
117
-
118
-
119
-
120
-
121
-
122
-
123
-
124
-
125
-
126
-
127
-
128
-
129
-
130
-
131
-
132
-
133
-
134
-
135
-
136
-
137
-
138
-
139
-
140
-
141
-
142
-
143
-
144
-
145
-
146
-
147
-
148
-
149
-
150
-
151
-
152
-
153
-
154
-
155
-
156
-
157
-
158
-
159
-
160
-
161
-
162
-
163
-
164
-
165
-
166
-
167
-
168
-
169
-
170
-
171
-
172
-
173
-
174
-
175
-
176
-
177
-
178
-
179
-
180
-
181
-
182
-
183
-
184
-
185
-
186
-
187
-
188
-
189
-
190
-
191
-
192
-
193
-
194
-
195
-
196
-
197
-
198
-
199
-
200
-
201
-
202
-
203
-
204
-
205
-
206
-
207
-
208
-
209
-
210
-
211
-
212
-
213
-
214
-
215
-
216
-
217
-
218
-
219
-
220
-
221
-
222
-
223
-
224
-
225
-
226
-
227
-
228
-
229
-
230
-
231
-
232
-
233
-
234
-
235
-
236
-
237
-
238
-
239
-
240
-
241
-
242
-
243
-
244
-
245
-
246
-
247
-
248
-
249
-
250
 |
 |

5 Group performance 5 - 5.1
58 Annual Report 2010
5Group performance
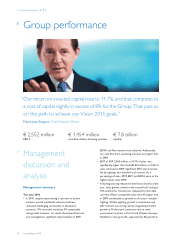
“Our return on invested capital rose to 11.7%, and that compares to
a cost of capital slightly in excess of 8% for the Group. That puts us
on the path to achieve our Vision 2015 goals.”
Pierre-Jean Sivignon, Chief Financial Officer
€ 2,552 million
EBITA € 1,454 million
cash flows before financing activities € 7.8 billion
liquidity
5.1 Management
discussion and
analysis
Management summary
The year 2010
•In 2010, despite experiencing a recovery in certain
markets, overall worldwide market conditions
remained challenging, particularly in developed
countries. We recorded moderate 4% comparable
sales growth; however, as a result of continued focus on
cost management, significant improvements in EBIT,
EBITA and Net income were achieved. Additionally,
our cash flow from operating activities was higher than
in 2009.
• EBIT of EUR 2,065 million, or 8.1% of sales, was
significantly higher than the EUR 614 million, or 2.6% of
sales, achieved in 2009. Significant EBIT improvement,
led by Lighting, was achieved in all sectors. As a
percentage of sales, 2010 EBIT and EBITA were at the
highest levels since 2000.
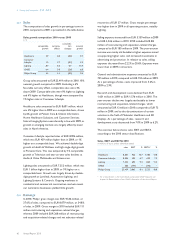
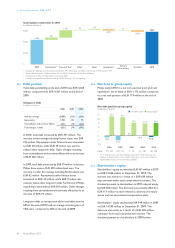
• Following a strong rebound in the first six months of the
year, sales growth slowed in the second half, ending at
10% nominal for the full year. Adjusted for favorable
currency effects, comparable sales were 4% higher than
in 2009, attributable to growth in all sectors, notably
Lighting. Within Lighting, growth in automotive and
LED markets was strong, partly mitigated by limited
growth at Professional Luminaires due to weak
construction markets in the US and Western Europe;
Healthcare sales grew 4%, supported by 6% growth in