Philips 2010 Annual Report Download - page 230
Download and view the complete annual report
Please find page 230 of the 2010 Philips annual report below. You can navigate through the pages in the report by either clicking on the pages listed below, or by using the keyword search tool below to find specific information within the annual report.-
 1
1 -
2
-
3
-
4
-
5
-
6
-
7
-
8
-
9
-
10
-
11
-
12
-
13
-
14
-
15
-
16
-
17
-
18
-
19
-
20
-
21
-
22
-
23
-
24
-
25
-
26
-
27
-
28
-
29
-
30
-
31
-
32
-
33
-
34
-
35
-
36
-
37
-
38
-
39
-
40
-
41
-
42
-
43
-
44
-
45
-
46
-
47
-
48
-
49
-
50
-
51
-
52
-
53
-
54
-
55
-
56
-
57
-
58
-
59
-
60
-
61
-
62
-
63
-
64
-
65
-
66
-
67
-
68
-
69
-
70
-
71
-
72
-
73
-
74
-
75
-
76
-
77
-
78
-
79
-
80
-
81
-
82
-
83
-
84
-
85
-
86
-
87
-
88
-
89
-
90
-
91
-
92
-
93
-
94
-
95
-
96
-
97
-
98
-
99
-
100
-
101
-
102
-
103
-
104
-
105
-
106
-
107
-
108
-
109
-
110
-
111
-
112
-
113
-
114
-
115
-
116
-
117
-
118
-
119
-
120
-
121
-
122
-
123
-
124
-
125
-
126
-
127
-
128
-
129
-
130
-
131
-
132
-
133
-
134
-
135
-
136
-
137
-
138
-
139
-
140
-
141
-
142
-
143
-
144
-
145
-
146
-
147
-
148
-
149
-
150
-
151
-
152
-
153
-
154
-
155
-
156
-
157
-
158
-
159
-
160
-
161
-
162
-
163
-
164
-
165
-
166
-
167
-
168
-
169
-
170
-
171
-
172
-
173
-
174
-
175
-
176
-
177
-
178
-
179
-
180
-
181
-
182
-
183
-
184
-
185
-
186
-
187
-
188
-
189
-
190
-
191
-
192
-
193
-
194
-
195
-
196
-
197
-
198
-
199
-
200
-
201
-
202
-
203
-
204
-
205
-
206
-
207
-
208
-
209
-
210
-
211
-
212
-
213
-
214
-
215
-
216
-
217
-
218
-
219
-
 220
220 -
 221
221 -
 222
222 -
 223
223 -
 224
224 -
 225
225 -
 226
226 -
 227
227 -
 228
228 -
 229
229 -
 230
230 -
 231
231 -
 232
232 -
 233
233 -
 234
234 -
 235
235 -
 236
236 -
 237
237 -
 238
238 -
 239
239 -
 240
240 -
241
-
242
-
243
-
244
-
245
-
246
-
247
-
248
-
249
-
250
 |
 |

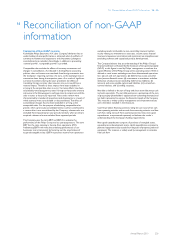
16 Reconciliation of non-GAAP information 16 - 16
230 Annual Report 2010
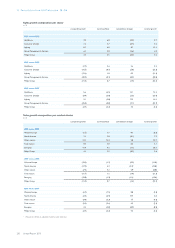
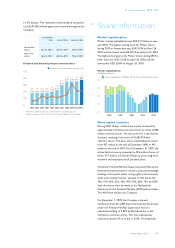
Sales growth composition per sector
in %
comparable growth currency effects consolidation changes nominal growth
2010 versus 2009
Healthcare 3.9 6.0 (0.2) 9.7
Consumer Lifestyle 1.2 4.7 (0.7) 5.2
Lighting 8.7 6.0 0.7 15.4
Group Management & Services 6.4 3.0 (2.6) 6.8
Philips Group 4.3 5.5 (0.2) 9.6
2009 versus 2008
Healthcare (2.7) 2.6 2.6 2.5
Consumer Lifestyle (16.5) (0.7) (5.0) (22.2)
Lighting (12.6) 1.0 0.5 (11.1)
Group Management & Services (30.2) (0.1) (0.2) (30.5)
Philips Group (11.4) 0.7 (1.4) (12.1)
2008 versus 2007
Healthcare 5.6 (4.5) 14.1 15.2
Consumer Lifestyle (8.9) (2.8) (5.2) (16.9)
Lighting 3.1 (3.8) 17.2 16.5
Group Management & Services (25.8) (0.8) (7.1) (33.7)
Philips Group (2.7) (3.3) 4.5 (1.5)
Sales growth composition per market cluster
in %
comparable growth currency effects consolidation changes nominal growth
2010 versus 2009
Western Europe (1.5) 1.1 0.1 (0.3)
North America 1.5 5.8 (0.1) 7.2
Other mature 12.5 14.4 2.8 29.7
Total mature 0.9 4.0 0.2 5.1
Emerging 11.9 9.5 (1.1) 20.3
Philips Group 4.3 5.5 (0.2) 9.6
2009 versus 2008
Western Europe (10.4) (1.2) (0.2) (11.8)1)
North America (13.9) 4.3 (3.2)1) (12.8)1)
Other mature (7.9) 4.2 2.91) (0.8)1)
Total mature (11.7) 1.6 (1.4) (11.5)
Emerging (10.8) (1.3) (1.5)1) (13.6)1)
Philips Group (11.4) 0.7 (1.4) (12.1)
2008 versus 2007
Western Europe (6.7) (1.5) 0.8 (7.4)
North America (2.5) (6.9) 15.4 6.0
Other mature (9.0) (3.3) 7.7 (4.6)
Total mature (5.4) (3.6) 6.9 (2.1)
Emerging 3.5 (2.8) (0.9) (0.2)
Philips Group (2.7) (3.3) 4.5 (1.5)
1) Revised to reflect an adjusted market cluster allocation