Philips 2010 Annual Report Download - page 187
Download and view the complete annual report
Please find page 187 of the 2010 Philips annual report below. You can navigate through the pages in the report by either clicking on the pages listed below, or by using the keyword search tool below to find specific information within the annual report.-
 1
1 -
2
-
3
-
4
-
5
-
6
-
7
-
8
-
9
-
10
-
11
-
12
-
13
-
14
-
15
-
16
-
17
-
18
-
19
-
20
-
21
-
22
-
23
-
24
-
25
-
26
-
27
-
28
-
29
-
30
-
31
-
32
-
33
-
34
-
35
-
36
-
37
-
38
-
39
-
40
-
41
-
42
-
43
-
44
-
45
-
46
-
47
-
48
-
49
-
50
-
51
-
52
-
53
-
54
-
55
-
56
-
57
-
58
-
59
-
60
-
61
-
62
-
63
-
64
-
65
-
66
-
67
-
68
-
69
-
70
-
71
-
72
-
73
-
74
-
75
-
76
-
77
-
78
-
79
-
80
-
81
-
82
-
83
-
84
-
85
-
86
-
87
-
88
-
89
-
90
-
91
-
92
-
93
-
94
-
95
-
96
-
97
-
98
-
99
-
100
-
101
-
102
-
103
-
104
-
105
-
106
-
107
-
108
-
109
-
110
-
111
-
112
-
113
-
114
-
115
-
116
-
117
-
118
-
119
-
120
-
121
-
122
-
123
-
124
-
125
-
126
-
127
-
128
-
129
-
130
-
131
-
132
-
133
-
134
-
135
-
136
-
137
-
138
-
139
-
140
-
141
-
142
-
143
-
144
-
145
-
146
-
147
-
148
-
149
-
150
-
151
-
152
-
153
-
154
-
155
-
156
-
157
-
158
-
159
-
160
-
161
-
162
-
163
-
164
-
165
-
166
-
167
-
168
-
169
-
170
-
171
-
172
-
173
-
174
-
175
-
176
-
 177
177 -
 178
178 -
 179
179 -
 180
180 -
 181
181 -
 182
182 -
 183
183 -
 184
184 -
 185
185 -
 186
186 -
 187
187 -
 188
188 -
 189
189 -
 190
190 -
 191
191 -
 192
192 -
 193
193 -
 194
194 -
 195
195 -
 196
196 -
 197
197 -
198
-
199
-
200
-
201
-
202
-
203
-
204
-
205
-
206
-
207
-
208
-
209
-
210
-
211
-
212
-
213
-
214
-
215
-
216
-
217
-
218
-
219
-
220
-
221
-
222
-
223
-
224
-
225
-
226
-
227
-
228
-
229
-
230
-
231
-
232
-
233
-
234
-
235
-
236
-
237
-
238
-
239
-
240
-
241
-
242
-
243
-
244
-
245
-
246
-
247
-
248
-
249
-
250
 |
 |

13 Group financial statements 13.11 - 13.11 29
Annual Report 2010 187
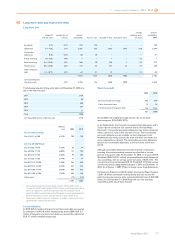
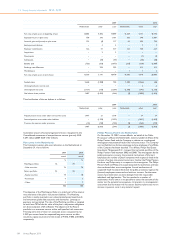
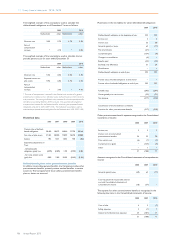
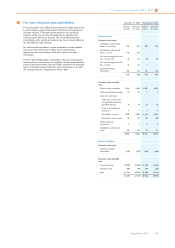
The weighted average assumptions used to calculate the
postretirement benefit obligations other than pensions as of December
31 were as follows:
2009 2010
Discount rate 6.7% 6.6%
Compensation increase (where applicable) − −
The weighted average assumptions used to calculate the net cost for
years ended December 31:
2009 2010
Discount rate 9.7% 6.7%
Compensation increase (where applicable) − −
Assumed healthcare cost trend rates at December 31:
2009 2010
Healthcare cost trend rate assumed for next year 9.0% 8.4%
Rate that the cost trend rate will gradually reach 5.0% 4.8%
Year of reaching the rate at which it is assumed to
remain 2018 2018
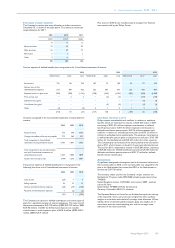
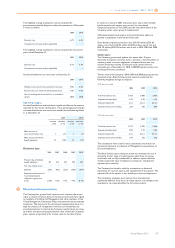
Sensitivity analysis
Assumed healthcare trend rates have a significant effect on the amounts
reported for the retiree medical plans. A one percentage-point change
in assumed healthcare cost trend rates would have the following effects
as at December 31:
2009 2010
increase
of 1% decrease
of 1% increase
of 1% decrease
of 1%
Effect on total of
service and interest cost 1 (1) 1 (1)
Effect on postretirement
benefit obligation 21 (18) 19 (17)
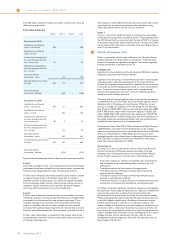
Historical data
2006 2007 2008 2009 2010
Present value of defined-
benefit obligation 373 413 353 295 297
Fair value of plan assets − − − − −
(Deficit) (373) (413) (353) (295) (297)
Experience adjustments in
% on defined-benefit
obligations; (gains) and
losses (1.6%) 0.2% 0.1% 4.9% (8.1%)
29 Share-based compensation
The Company has granted stock options on its common shares and
rights to receive common shares in the future (restricted share rights)
to members of the Board of Management and other members of the
Group Management Committee, Philips executives and certain selected
employees. The purpose of the share-based compensation plans is to
align the interests of management with those of shareholders by
providing incentives to improve the Company’s performance on a long-
term basis, thereby increasing shareholder value. Under the Company’s
plans, options are granted at fair market value on the date of grant.
In contrast to the year 2001 and certain prior years, when variable
(performance) stock options were issued, the share-based
compensation grants as from 2002 consider the performance of the
Company versus a peer group of multinationals.
USD-denominated stock options and restricted share rights are
granted to employees in the United States only.
Share-based compensation expense was EUR 83 million (EUR 66
million, net of tax), EUR 94 million (EUR 86 million, net of tax) and
EUR 78 million (EUR 106 million, net of tax) in 2010, 2009 and 2008,
respectively.
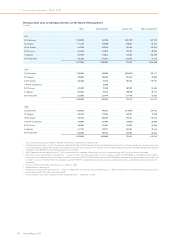
Option plans
The Company grants stock options that expire after 10 years.
Generally, the options vest after 3 years; however, a limited number of
options granted to certain employees of acquired businesses may
contain accelerated vesting. Of the total stock options that are
outstanding as of December 31, 2010, 2,500,000 options contain non-
market performance conditions.
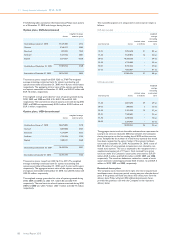
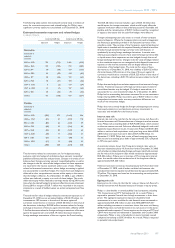
The fair value of the Company’s 2010, 2009 and 2008 option grants was
estimated using a Black-Scholes option valuation model and the
following weighted average assumptions:
EUR-denominated
2008 2009 2010
Risk-free interest rate 3.75% 2.88% 2.43%
Expected dividend yield 2.4% 4.3% 4.1%
Expected option life 6 yrs 6.5 yrs 6.5 yrs
Expected share price volatility 26% 32% 30%
USD-denominated
2008 2009 2010
Risk-free interest rate 3.17% 2.25% 2.43%
Expected dividend yield 2.8% 4.1% 3.9%
Expected option life 6 yrs 6.5 yrs 6.5 yrs
Expected share price volatility 27% 33% 32%
The assumptions were used for these calculations only and do not
necessarily represent an indication of Management’s expectations of
future developments.
The Black-Scholes option valuation model was developed for use in
estimating the fair value of traded options which have no vesting
restrictions and are fully transferable. In addition, option valuation
models require the input of subjective assumptions, including the
expected price volatility.
The Company has based its volatility assumptions on historical
experience for a period equal to the expected life of the options. The
expected life of the options is also based upon historical experience.
The Company’s employee stock options have characteristics
significantly different from those of traded options, and changes in the
assumptions can materially affect the fair value estimate.