Philips 2010 Annual Report Download - page 171
Download and view the complete annual report
Please find page 171 of the 2010 Philips annual report below. You can navigate through the pages in the report by either clicking on the pages listed below, or by using the keyword search tool below to find specific information within the annual report.-
 1
1 -
2
-
3
-
4
-
5
-
6
-
7
-
8
-
9
-
10
-
11
-
12
-
13
-
14
-
15
-
16
-
17
-
18
-
19
-
20
-
21
-
22
-
23
-
24
-
25
-
26
-
27
-
28
-
29
-
30
-
31
-
32
-
33
-
34
-
35
-
36
-
37
-
38
-
39
-
40
-
41
-
42
-
43
-
44
-
45
-
46
-
47
-
48
-
49
-
50
-
51
-
52
-
53
-
54
-
55
-
56
-
57
-
58
-
59
-
60
-
61
-
62
-
63
-
64
-
65
-
66
-
67
-
68
-
69
-
70
-
71
-
72
-
73
-
74
-
75
-
76
-
77
-
78
-
79
-
80
-
81
-
82
-
83
-
84
-
85
-
86
-
87
-
88
-
89
-
90
-
91
-
92
-
93
-
94
-
95
-
96
-
97
-
98
-
99
-
100
-
101
-
102
-
103
-
104
-
105
-
106
-
107
-
108
-
109
-
110
-
111
-
112
-
113
-
114
-
115
-
116
-
117
-
118
-
119
-
120
-
121
-
122
-
123
-
124
-
125
-
126
-
127
-
128
-
129
-
130
-
131
-
132
-
133
-
134
-
135
-
136
-
137
-
138
-
139
-
140
-
141
-
142
-
143
-
144
-
145
-
146
-
147
-
148
-
149
-
150
-
151
-
152
-
153
-
154
-
155
-
156
-
157
-
158
-
159
-
160
-
 161
161 -
 162
162 -
 163
163 -
 164
164 -
 165
165 -
 166
166 -
 167
167 -
 168
168 -
 169
169 -
 170
170 -
 171
171 -
 172
172 -
 173
173 -
 174
174 -
 175
175 -
 176
176 -
 177
177 -
 178
178 -
 179
179 -
 180
180 -
 181
181 -
182
-
183
-
184
-
185
-
186
-
187
-
188
-
189
-
190
-
191
-
192
-
193
-
194
-
195
-
196
-
197
-
198
-
199
-
200
-
201
-
202
-
203
-
204
-
205
-
206
-
207
-
208
-
209
-
210
-
211
-
212
-
213
-
214
-
215
-
216
-
217
-
218
-
219
-
220
-
221
-
222
-
223
-
224
-
225
-
226
-
227
-
228
-
229
-
230
-
231
-
232
-
233
-
234
-
235
-
236
-
237
-
238
-
239
-
240
-
241
-
242
-
243
-
244
-
245
-
246
-
247
-
248
-
249
-
250
 |
 |

13 Group financial statements 13.11 - 13.11 7
Annual Report 2010 171
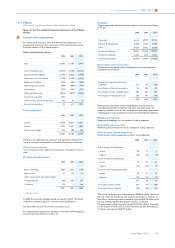
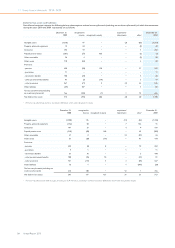
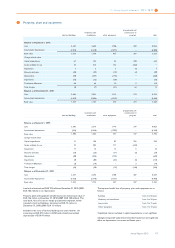
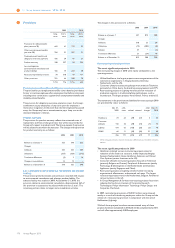
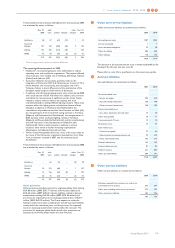
7Property, plant and equipment
land and buildings machinery and
installations other equipment
prepayments and
construction in
progress total
Balance as of January 1, 2010:
Cost 2,447 3,692 1,708 207 8,054
Accumulated depreciation (1,013) (2,518) (1,271) − (4,802)
Book value 1,434 1,174 437 207 3,252
Change in book value:
Capital expenditures 67 134 24 428 653
Assets available for use 24 212 126 (362) −
Acquisitions 1 2 5 (1) 7
Disposals and sales (32) (32) (19) (4) (87)
Depreciation (95) (357) (176) − (628)
Impairments (18) (12) (20) − (50)
Translation differences 48 46 19 5 118
Total changes (5) (7) (41) 66 13
Balance as of December 31, 2010:
Cost 2,486 3,851 1,715 273 8,325
Accumulated depreciation (1,057) (2,684) (1,319) − (5,060)
Book value 1,429 1,167 396 273 3,265
land and buildings machinery and
installations other equipment
prepayments and
construction in
progress total
Balance as of January 1, 2009:
Cost 2,396 3,576 1,746 347 8,065
Accumulated depreciation (916) (2,354) (1,299) − (4,569)
Book value 1,480 1,222 447 347 3,496
Change in book value:
Capital expenditures 21 120 87 296 524
Assets available for use 32 285 117 (434) −
Acquisitions 17 12 12 5 46
Disposals and sales (15) (23) (11) (5) (54)
Depreciation (89) (344) (192) − (625)
Impairments (9) (84) (23) (5) (121)
Translation differences (3) (14) − 3 (14)
Total changes (46) (48) (10) (140) (244)
Balance as of December 31, 2009:
Cost 2,447 3,692 1,708 207 8,054
Accumulated depreciation (1,013) (2,518) (1,271) − (4,802)
Book value 1,434 1,174 437 207 3,252
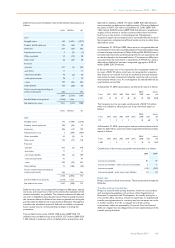
Land with a book value of EUR 193 million at December 31, 2010 (2009:
EUR 186 million) is not depreciated.
Property, plant and equipment include lease assets with a book value of
EUR 156 million at December 31, 2010 (2009: EUR 128 million). The
total book value of assets no longer productively employed, mainly
included in land and buildings, amounted to EUR 15 million at
December 31, 2010 (2009: EUR 11 million).
Included in the costs of land and buildings are assets held for sale
amounting to EUR 213 million in 2010 with related accumulated
depreciation of EUR 93 million.
The expected useful lives of property, plant and equipment are as
follows:
Buildings from 5 to 50 years
Machinery and installations from 3 to 20 years
Lease assets from 1 to 15 years
Other equipment from 1 to 10 years
Capitalized interest included in capital expenditures is not significant.
Changes in expected useful lives and residual values have an insignificant
effect on depreciation in current and future years.