Philips 2010 Annual Report Download - page 180
Download and view the complete annual report
Please find page 180 of the 2010 Philips annual report below. You can navigate through the pages in the report by either clicking on the pages listed below, or by using the keyword search tool below to find specific information within the annual report.-
 1
1 -
2
-
3
-
4
-
5
-
6
-
7
-
8
-
9
-
10
-
11
-
12
-
13
-
14
-
15
-
16
-
17
-
18
-
19
-
20
-
21
-
22
-
23
-
24
-
25
-
26
-
27
-
28
-
29
-
30
-
31
-
32
-
33
-
34
-
35
-
36
-
37
-
38
-
39
-
40
-
41
-
42
-
43
-
44
-
45
-
46
-
47
-
48
-
49
-
50
-
51
-
52
-
53
-
54
-
55
-
56
-
57
-
58
-
59
-
60
-
61
-
62
-
63
-
64
-
65
-
66
-
67
-
68
-
69
-
70
-
71
-
72
-
73
-
74
-
75
-
76
-
77
-
78
-
79
-
80
-
81
-
82
-
83
-
84
-
85
-
86
-
87
-
88
-
89
-
90
-
91
-
92
-
93
-
94
-
95
-
96
-
97
-
98
-
99
-
100
-
101
-
102
-
103
-
104
-
105
-
106
-
107
-
108
-
109
-
110
-
111
-
112
-
113
-
114
-
115
-
116
-
117
-
118
-
119
-
120
-
121
-
122
-
123
-
124
-
125
-
126
-
127
-
128
-
129
-
130
-
131
-
132
-
133
-
134
-
135
-
136
-
137
-
138
-
139
-
140
-
141
-
142
-
143
-
144
-
145
-
146
-
147
-
148
-
149
-
150
-
151
-
152
-
153
-
154
-
155
-
156
-
157
-
158
-
159
-
160
-
161
-
162
-
163
-
164
-
165
-
166
-
167
-
168
-
169
-
 170
170 -
 171
171 -
 172
172 -
 173
173 -
 174
174 -
 175
175 -
 176
176 -
 177
177 -
 178
178 -
 179
179 -
 180
180 -
 181
181 -
 182
182 -
 183
183 -
 184
184 -
 185
185 -
 186
186 -
 187
187 -
 188
188 -
 189
189 -
 190
190 -
191
-
192
-
193
-
194
-
195
-
196
-
197
-
198
-
199
-
200
-
201
-
202
-
203
-
204
-
205
-
206
-
207
-
208
-
209
-
210
-
211
-
212
-
213
-
214
-
215
-
216
-
217
-
218
-
219
-
220
-
221
-
222
-
223
-
224
-
225
-
226
-
227
-
228
-
229
-
230
-
231
-
232
-
233
-
234
-
235
-
236
-
237
-
238
-
239
-
240
-
241
-
242
-
243
-
244
-
245
-
246
-
247
-
248
-
249
-
250
 |
 |

23 24 13 Group financial statements 13.11 - 13.11
180 Annual Report 2010
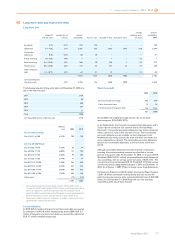
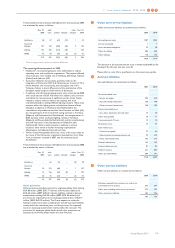
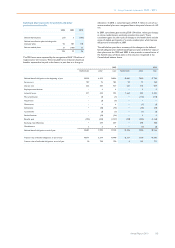
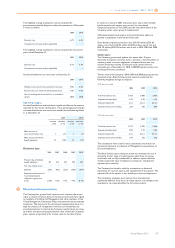
23 Contractual obligations
Contractual cash obligations at December 31, 2010
in millions of euros
payments due by period
total less than
1 year 1-3 years 3-5 years after 5
years
Long-term debt1) 3,808 1,111 493 254 1,950
Finance lease
obligations1) 178 44 65 29 40
Short-term debt1,4) 686 686 − − −
Operating leases1) 640 173 234 123 110
Derivative assets and
liabilities1) 472 47 374 51 −
Interest on debt2) 1,596 161 207 190 1,038
Trade and other
payables3) 3,691 3,691 − − −
11,071 5,913 1,373 647 3,138
1) Short-term debt, long-term debt, lease obligations and derivatives are included
in the Company’s consolidated balance sheet
2) Approximately 45% of the debt bears interest at a floating rate. Interest on debt
has been estimated based upon average rates in 2010
3) Excluding derivatives, shown separately
4) Excluding current portion of long-term debt
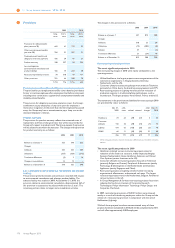
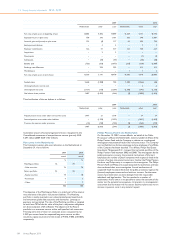
The estimated total purchase obligations as of December 31, 2010,
amount to EUR 365 million. This amount can be split in EUR 324 million
with a payment due in less than 1 year, EUR 17 million due in 1-3 years,
EUR 6 million due in 3-5 years and EUR 18 million due in more than 5
years.
Long-term operating lease commitments totaled EUR 640 million
(2009: EUR 666 million). These leases expire at various dates during the
next 20 years. The long-term operating leases are mainly related to the
rental of buildings.
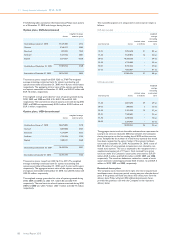
A number of these leases originate from sale-and-leaseback
arrangements. Operating lease payments under sale-and-leaseback
arrangements for 2010 totaled EUR 16 million (2009: EUR 17 million).
The remaining minimum payments from operating leases originating
from sale-and-leaseback arrangements are as follows:
2011 16
2012 16
2013 16
2014 16
2015 12
Thereafter 48
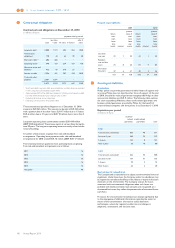
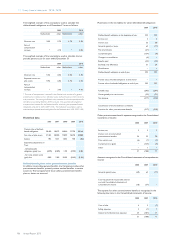
Finance lease liabilities
2009 2010
future
mini-
mum
lease
pay-
ments interest
present
value of
mini-
mum
lease
pay-
ments
future
mini-
mum
lease
pay-
ments interest
present
value of
mini-
mum
lease
pay-
ments
Less than
one year 33 1 32 44 1 43
Between
one and five
years 73 8 65 94 9 85
More than
five years 47 6 41 40 4 36
153 15 138 178 14 164
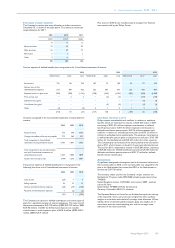
24 Contingent liabilities
Guarantees
Philips’ policy is to provide guarantees and other letters of support only
in writing. Philips does not stand by other forms of support. At the end
of 2010, the total fair value of guarantees recognized by Philips in other
non-current liabilities was EUR 9 million. The following table outlines
the total outstanding off-balance sheet credit-related guarantees and
business-related guarantees provided by Philips for the benefit of
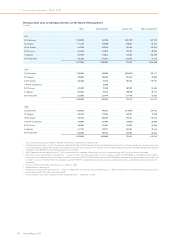
unconsolidated companies and third parties as at December 31, 2010.
Expiration per period
in millions of euros
business-
related
guarantees credit-related
guarantees total
2010
Total amounts committed 302 49 351
Less than 1 year 100 22 122
1-5 years 133 8 141
After 5 years 69 19 88
2009
Total amounts committed 266 42 308
Less than 1 year 134 31 165
1-5 years 70 5 75
After 5 years 62 6 68
Environmental remediation
The Company and its subsidiaries are subject to environmental laws and
regulations. Under these laws, the Company and/or its subsidiaries may
be required to remediate the effects of the release or disposal of certain
chemicals on the environment. The Company accrues for losses
associated with environmental obligations when such losses are
probable and reliably estimable. Such amounts are recognized on a
discounted basis since they reflect the present value of estimated future
cash flows.
Provisions for environmental remediation can change significantly due
to the emergence of additional information regarding the extent or
nature of the contamination, the need to utilize alternative
technologies, actions by regulatory authorities and changes in
judgments, assumptions, and discount rates.