Philips 2010 Annual Report Download - page 150
Download and view the complete annual report
Please find page 150 of the 2010 Philips annual report below. You can navigate through the pages in the report by either clicking on the pages listed below, or by using the keyword search tool below to find specific information within the annual report.-
 1
1 -
2
-
3
-
4
-
5
-
6
-
7
-
8
-
9
-
10
-
11
-
12
-
13
-
14
-
15
-
16
-
17
-
18
-
19
-
20
-
21
-
22
-
23
-
24
-
25
-
26
-
27
-
28
-
29
-
30
-
31
-
32
-
33
-
34
-
35
-
36
-
37
-
38
-
39
-
40
-
41
-
42
-
43
-
44
-
45
-
46
-
47
-
48
-
49
-
50
-
51
-
52
-
53
-
54
-
55
-
56
-
57
-
58
-
59
-
60
-
61
-
62
-
63
-
64
-
65
-
66
-
67
-
68
-
69
-
70
-
71
-
72
-
73
-
74
-
75
-
76
-
77
-
78
-
79
-
80
-
81
-
82
-
83
-
84
-
85
-
86
-
87
-
88
-
89
-
90
-
91
-
92
-
93
-
94
-
95
-
96
-
97
-
98
-
99
-
100
-
101
-
102
-
103
-
104
-
105
-
106
-
107
-
108
-
109
-
110
-
111
-
112
-
113
-
114
-
115
-
116
-
117
-
118
-
119
-
120
-
121
-
122
-
123
-
124
-
125
-
126
-
127
-
128
-
129
-
130
-
131
-
132
-
133
-
134
-
135
-
136
-
137
-
138
-
139
-
 140
140 -
 141
141 -
 142
142 -
 143
143 -
 144
144 -
 145
145 -
 146
146 -
 147
147 -
 148
148 -
 149
149 -
 150
150 -
 151
151 -
 152
152 -
 153
153 -
 154
154 -
 155
155 -
 156
156 -
 157
157 -
 158
158 -
 159
159 -
 160
160 -
161
-
162
-
163
-
164
-
165
-
166
-
167
-
168
-
169
-
170
-
171
-
172
-
173
-
174
-
175
-
176
-
177
-
178
-
179
-
180
-
181
-
182
-
183
-
184
-
185
-
186
-
187
-
188
-
189
-
190
-
191
-
192
-
193
-
194
-
195
-
196
-
197
-
198
-
199
-
200
-
201
-
202
-
203
-
204
-
205
-
206
-
207
-
208
-
209
-
210
-
211
-
212
-
213
-
214
-
215
-
216
-
217
-
218
-
219
-
220
-
221
-
222
-
223
-
224
-
225
-
226
-
227
-
228
-
229
-
230
-
231
-
232
-
233
-
234
-
235
-
236
-
237
-
238
-
239
-
240
-
241
-
242
-
243
-
244
-
245
-
246
-
247
-
248
-
249
-
250
 |
 |

13 Group financial statements 13.8 - 13.8
150 Annual Report 2010
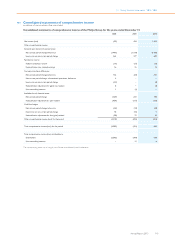
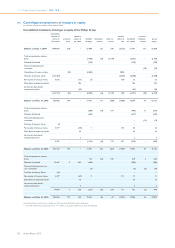
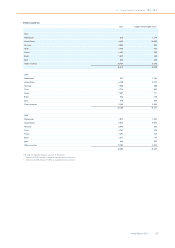
13.8 Consolidated statements of changes in equity
in millions of euros unless otherwise stated
Consolidated statements of changes in equity of the Philips Group
outstanding
number of
shares in
thousands common
share
capital in
excess of
par value retained
earnings revaluation
reserve other re-
serves
treasury
shares at
cost sharehold-
ers’ equity
non-con-
trolling in-
terests1)
group
equity
Balance as of Jan. 1, 2008 1,064,893 228 − 22,998 133 598 (2,216) 21,741 127 21,868
Total comprehensive income
(loss) (1,108) (16) (1,178) (2,302)− (2,302)
Dividend distributed (720) (720) (720)
Non-controlling interests
movement (78) (78)
Cancellation of treasury shares (34) (4,062) 4,096 − −
Purchase of treasury shares (146,453) (3,298) (3,298) (3,298)
Re-issuance of treasury shares 4,542 (71) (7) 130 52 52
Share-based compensation plans 106 106 106
Income tax share-based
compensation plans (35) (35) (35)
(141,911) (34) − (5,897) (16) (1,178) 928 (6,197) (78) (6,275)
Balance as of Dec. 31, 2008 922,982 194 − 17,101 117 (580) (1,288) 15,544 49 15,593
Total comprehensive income
(loss) (508) (15) 119 (404) 13 (391)
Dividend distributed (647) (647) (647)
Non-controlling interests
movement − (13) (13)
Purchase of treasury shares (2) − −
Re-issuance of treasury shares 4,477 (70) 1 101 32 32
Share-based compensation plans 65 65 65
Income tax share-based
compensation plans 5 5 5
4,475 − − (1,154) (15) 119 101 (949) − (949)
Balance as of Dec. 31, 2009 927,457 194 − 15,947 102 (461) (1,187) 14,595 49 14,644
Total comprehensive income
(loss) 116 (16)530 630 6 636
Dividend distributed 13,667 3 343 (650) (304) (304)
Non-controlling interests buy
out / movement (6) (6) (9) (15)
Purchase of treasury shares (15) − −
Re-issuance of treasury shares 5,397 (49) 9 111 71 71
Share-based compensation plans 55 55 55
Income tax share-based
compensation plans 5 5 5
19,049 3 354 (531) (16) 530 111 451 (3) 448
Balance as of Dec. 31, 2010 946,506 197 354 15,416 86 69 (1,076) 15,046 46 15,092
The accompanying notes are an integral part of these consolidated financial statements.
1) Of which discontinued operations EUR (77) million at August 6, 2008 due to sale of MedQuist