Philips 2010 Annual Report Download - page 217
Download and view the complete annual report
Please find page 217 of the 2010 Philips annual report below. You can navigate through the pages in the report by either clicking on the pages listed below, or by using the keyword search tool below to find specific information within the annual report.-
 1
1 -
2
-
3
-
4
-
5
-
6
-
7
-
8
-
9
-
10
-
11
-
12
-
13
-
14
-
15
-
16
-
17
-
18
-
19
-
20
-
21
-
22
-
23
-
24
-
25
-
26
-
27
-
28
-
29
-
30
-
31
-
32
-
33
-
34
-
35
-
36
-
37
-
38
-
39
-
40
-
41
-
42
-
43
-
44
-
45
-
46
-
47
-
48
-
49
-
50
-
51
-
52
-
53
-
54
-
55
-
56
-
57
-
58
-
59
-
60
-
61
-
62
-
63
-
64
-
65
-
66
-
67
-
68
-
69
-
70
-
71
-
72
-
73
-
74
-
75
-
76
-
77
-
78
-
79
-
80
-
81
-
82
-
83
-
84
-
85
-
86
-
87
-
88
-
89
-
90
-
91
-
92
-
93
-
94
-
95
-
96
-
97
-
98
-
99
-
100
-
101
-
102
-
103
-
104
-
105
-
106
-
107
-
108
-
109
-
110
-
111
-
112
-
113
-
114
-
115
-
116
-
117
-
118
-
119
-
120
-
121
-
122
-
123
-
124
-
125
-
126
-
127
-
128
-
129
-
130
-
131
-
132
-
133
-
134
-
135
-
136
-
137
-
138
-
139
-
140
-
141
-
142
-
143
-
144
-
145
-
146
-
147
-
148
-
149
-
150
-
151
-
152
-
153
-
154
-
155
-
156
-
157
-
158
-
159
-
160
-
161
-
162
-
163
-
164
-
165
-
166
-
167
-
168
-
169
-
170
-
171
-
172
-
173
-
174
-
175
-
176
-
177
-
178
-
179
-
180
-
181
-
182
-
183
-
184
-
185
-
186
-
187
-
188
-
189
-
190
-
191
-
192
-
193
-
194
-
195
-
196
-
197
-
198
-
199
-
200
-
201
-
202
-
203
-
204
-
205
-
206
-
 207
207 -
 208
208 -
 209
209 -
 210
210 -
 211
211 -
 212
212 -
 213
213 -
 214
214 -
 215
215 -
 216
216 -
 217
217 -
 218
218 -
 219
219 -
 220
220 -
 221
221 -
 222
222 -
 223
223 -
 224
224 -
 225
225 -
 226
226 -
 227
227 -
228
-
229
-
230
-
231
-
232
-
233
-
234
-
235
-
236
-
237
-
238
-
239
-
240
-
241
-
242
-
243
-
244
-
245
-
246
-
247
-
248
-
249
-
250
 |
 |

15 Sustainability statements 15.5 - 15.6
Annual Report 2010 217
concerning alleged violations of the code, compared to four complaints
in 2009 and five in 2008. As such, the number of complaints relating to
purchasing employees who allegedly did not adhere to the Philips Supply
Management Code of Ethics was about half the number reported in the
years prior to 2008.
The category Other
Lastly, allegations in the category Other represented 7% of the
reported complaints compared with 17% in the previous year. In 2010
we noted a further decrease in the number of complaints by employees
of new acquisitions regarding inconsistencies between the pre-
acquistion style of management and the underlying principles of
business conduct defined in the Philips GBP. It was precisely this type of
complaint that in the previous period accounted for the marked
increase in the number of complaints in this category. The roll-out of
dedicated training and communication programs, geared to aligning the
previous management style with that of Philips, has clearly borne fruit
here.
Actual violations versus non-violations
Although 84 of the 338 GBP complaints reported in 2010 are still
pending (especially those lodged during the last three months of the
year), out of the 254 complaints investigated, it was found that roughly
one third (31%) were justified. In 2009 almost 40% of complaints were
actual violations; in 2008 a quarter of complaints turned out to be
justified after investigation.
With regard to the investigated complaints in the Business Integrity
category, the percentage of complaints that were justified fell to 46%,
below the level of the previous two years (2009: 60%; 2008: 57%). Also
in the other major category, i.e. complaints regarding Treatment of
employees, there was a decrease in the number of justified complaints
in 2010, to 17% of the total number of complaints in this category
compared to 25% in 2009 and 13% in 2008.
Social Investment Programs
In 2010, we expanded our SimplyHealthy@Schools community
program into 38 countries, reaching almost 63,000 students, going to
over 660 schools and actively involving more than 3,500 employees
from around the world. The program builds on past experience where
employees applied their knowledge and volunteered in local schools to
upgrade lighting and educate children on energy efficiency.
We continued our support of the American Heart Association’s Start!
Heart Walk multi-city events. Over 2,000 Philips employees
volunteered for this program.
In the Netherlands, Philips employees supported a fundraising action by
radio station 3FM, and raised EUR 225,000 for the Red Cross to
support children around the globe orphaned as a result of parents’
contracting HIV/AIDS. In China we continued to support Project HOPE
to target chronic disease areas: heart disease, stroke and respiratory
disease as part of a three-year program, announced in 2009.
By linking our social investment initiatives with the scope of
our business, we make our core competencies available to simply make
a difference in people’s lives and are involved in multiple projects in
other countries as well.
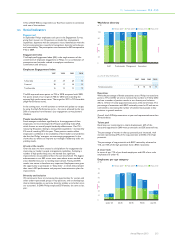
Health and Safety
Philips strives for an injury and illness-free work environment, with a
sharp focus on decreasing the number of injuries. This is defined as a
KPI, on which we set yearly targets for the company and our individual
sectors.
In 2010 we recorded 482 Lost Workday Injuries cases, occupational
injury cases where the injured person is unable to work the day after
the injury. This is a 11% increase compared with 2009. The number of
Lost Workdays caused by these injuries amounted to 12,627 days. The
rate of Lost Workday Injuries increased to 0.50 per 100 FTEs,
compared with 0.44 in 2009.
Lost Workday Injuries
per 100 FTEs
2007 2008 2009 2010
Healthcare 0.29 0.27 0.20 0.25
Consumer Lifestyle 0.61 0.44 0.26 0.26
Lighting 1.35 1.17 0.76 0.80
Group Management & Services 0.12 0.12 0.07 0.13
Philips Group 0.81 0.68 0.44 0.50
The increase was driven by Lighting and Healthcare, where a number of
new acquisitions reported for the first time in 2010. In Lighting a
dedicated action program is in place to drive down injury levels that
started four years ago. We started a number of health and safety
initiatives in the other sectors as well.
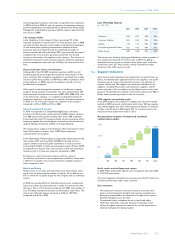
15.6 Supplier indicators
Given the size and complexity of our supply chain we need to focus our
efforts, and developed an approach based on the supplier’s risk profile
related to spend, country of production, business risk and type of
supplier relationship. 966 supplier sites have been identified as risk
suppliers, including 916 product and component suppliers, and 50
service providers. All risk suppliers are by definition part of our audit
program. The identified risk suppliers in the audit program cover 98% of
Philips’ annual purchasing volume in the risk countries.
2010 supplier sustainability audits
In the 2010 program we audited 113 supplier sites that were already
audited in 2007 (continual conformance audits), plus 100 new supplier
sites and 60 supplier sites from newly acquired companies. So the total
number of audits done in 2010 equals 273. As in previous years, the
majority of these audits were done in China.
Accumulative number of initial and continual
conformance audits
1,800
1,200
600
0
150
05
365
06
166
07
277
08
360
09
273
10
1,591
total
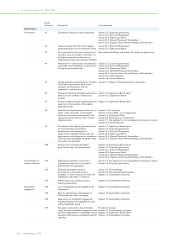
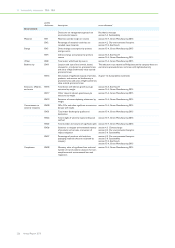
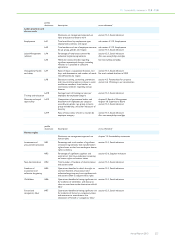
Audit results and challenges per region
In 2010, Philips audited 273 supplier sites, bringing the total since 2005
to 1,591 full scope audits.
The most frequently identified issues coming out of the 273 initial and
continual conformance audits were as follows.
Zero tolerance
• Working hours: excessive overtime, continual seven-day work
weeks, record-keeping of standard and overtime working hours
• Emergency preparedness: fire detection and suppression systems,
blocked emergency exits, fire drills
• Occupational safety: immediate threat to health and safety
• Hazardous substances: improper disposal of hazardous waste
• Industrial hygiene: appropriate controls for worker exposures to
chemical, biological and physical agents