Philips 2010 Annual Report Download - page 212
Download and view the complete annual report
Please find page 212 of the 2010 Philips annual report below. You can navigate through the pages in the report by either clicking on the pages listed below, or by using the keyword search tool below to find specific information within the annual report.-
 1
1 -
2
-
3
-
4
-
5
-
6
-
7
-
8
-
9
-
10
-
11
-
12
-
13
-
14
-
15
-
16
-
17
-
18
-
19
-
20
-
21
-
22
-
23
-
24
-
25
-
26
-
27
-
28
-
29
-
30
-
31
-
32
-
33
-
34
-
35
-
36
-
37
-
38
-
39
-
40
-
41
-
42
-
43
-
44
-
45
-
46
-
47
-
48
-
49
-
50
-
51
-
52
-
53
-
54
-
55
-
56
-
57
-
58
-
59
-
60
-
61
-
62
-
63
-
64
-
65
-
66
-
67
-
68
-
69
-
70
-
71
-
72
-
73
-
74
-
75
-
76
-
77
-
78
-
79
-
80
-
81
-
82
-
83
-
84
-
85
-
86
-
87
-
88
-
89
-
90
-
91
-
92
-
93
-
94
-
95
-
96
-
97
-
98
-
99
-
100
-
101
-
102
-
103
-
104
-
105
-
106
-
107
-
108
-
109
-
110
-
111
-
112
-
113
-
114
-
115
-
116
-
117
-
118
-
119
-
120
-
121
-
122
-
123
-
124
-
125
-
126
-
127
-
128
-
129
-
130
-
131
-
132
-
133
-
134
-
135
-
136
-
137
-
138
-
139
-
140
-
141
-
142
-
143
-
144
-
145
-
146
-
147
-
148
-
149
-
150
-
151
-
152
-
153
-
154
-
155
-
156
-
157
-
158
-
159
-
160
-
161
-
162
-
163
-
164
-
165
-
166
-
167
-
168
-
169
-
170
-
171
-
172
-
173
-
174
-
175
-
176
-
177
-
178
-
179
-
180
-
181
-
182
-
183
-
184
-
185
-
186
-
187
-
188
-
189
-
190
-
191
-
192
-
193
-
194
-
195
-
196
-
197
-
198
-
199
-
200
-
201
-
 202
202 -
 203
203 -
 204
204 -
 205
205 -
 206
206 -
 207
207 -
 208
208 -
 209
209 -
 210
210 -
 211
211 -
 212
212 -
 213
213 -
 214
214 -
 215
215 -
 216
216 -
 217
217 -
 218
218 -
 219
219 -
 220
220 -
 221
221 -
 222
222 -
223
-
224
-
225
-
226
-
227
-
228
-
229
-
230
-
231
-
232
-
233
-
234
-
235
-
236
-
237
-
238
-
239
-
240
-
241
-
242
-
243
-
244
-
245
-
246
-
247
-
248
-
249
-
250
 |
 |

15 Sustainability statements 15.3 - 15.4
212 Annual Report 2010
Consumer Lifestyle
In 2010 the Consumer Lifestyle sector invested about EUR 115 million
in Green Innovations, some EUR 16 million less compared to 2009. The
sector is dedicated to developing new Green Products with a focus on
further enhancing energy efficiency and closing material loops, for
example by using recycled materials or offering better recyclability.
Lighting
In 2010 Lighting invested a record amount of EUR 230 million in Green
Innovations compared to EUR 185 million in 2009. Our focus continues
to be on developing new energy-efficient lighting solutions, further
enhancing current Green Products and realizing technological
breakthroughs in the area of solid-state lighting.
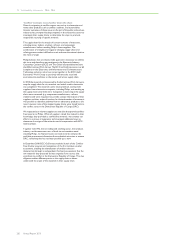
Research
Corporate Research invested about EUR 46 million, spread over Green
Innovation projects focused on global challenges related to water, air,
waste and energy. An example of a Philips Research project is related to
LED-based treatments. Many diseases, e.g. in dermatology or pain,
currently are treated with drugs like steroids, cortisone and opiates.
These unfortunately often cause negative side effects. Philips Lighting’s
Light & Health Venture, in close collaboration with Philips Research are
developing innovative LED-based, personalized and safe-in-house
treatments stimulating the natural self-healing processes of human cells.
Key benefits of this innovation are the significant reduction or even full
abandonment of chemicals and an increased ability of patients to
continue everyday activities without the hindrances such diseases
generate.
Operational energy efficiency and carbon footprint
During 2010 we continued to improve our data collection and analysis
process, further increasing data accuracy and relying less on estimates.
Moreover, to maintain comparability, we recalculated several figures
from 2008 and 2009 based on new insights. For instance, we increased
the number of non-industrial sites for which we collected actual data,
thereby reducing the estimated number. Additionally, data accuracy of
CO2 emissions of logistics – sea, road and air freight – has been further
improved, which also decreases the amount of estimates.
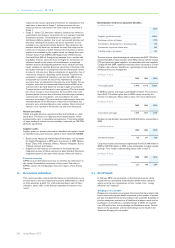
Our operational carbon footprint decreased 7% in 2010.
Operational carbon footprint
in kilotons CO2-equivalent
2007 2008 2009 2010
Manufacturing 948 959 910 754
Non-industrial operations 218 216 193 143
Business travel 276 265 220 247
Logistics 715 704 614 664
Total Philips Group 2,157 2,144 1,937 1,808
Our total operational carbon footprint can also be expressed according
to the three scopes of the Greenhouse Gas Protocol.
Operational carbon footprint by Greenhouse Gas
Protocol scopes
in kilotons CO2-equivalent
2007 2008 2009 2010
Scope 1 449 474 440 427
Scope 2 717 701 663 470
Scope 3 991 969 834 911
Total Philips Group 2,157 2,144 1,937 1,808
Operational energy efficiency and carbon footprint: 2010
details
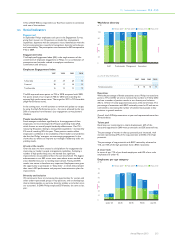
The 2010 results can be attributed to several factors:
• Accounting for 42% of the total footprint, total CO2 emissions from
manufacturing decreased 17% due to continued energy efficiency
improvement programs and mainly by further increasing the share of
purchased electricity from renewable sources to 39%.
•CO2 emissions from non-industrial operations (offices, warehouses,
etc.), which represents 8% of the total, decreased 26%. We
continued to centralize and re-allocate facilities, focusing on the
most efficient use of facility space, thereby reducing total amount of
facility space by 6%. Additionally, an increased share of purchased
electricity from renewable sources contributed to the reduction in
CO2 emissions.
• The total CO2 emissions related to business travel increased 13%. As
sales increased compared to 2009, the number of travel movements
grew as well. However, due to our green lease car policy, CO2
emissions from lease cars decreased 5% compared with 2009. We
will continue to promote videoconferencing as well.
• Overall CO2 emissions from logistics, representing approximately
one third of the total, increased 8%. This increase is strongly related
to the fact that we sold more products than in 2009, and therefore
also transported more products. Emissions from both sea and air
freight increased 15%. However, due to stock relocation and further
route optimization, CO2 emissions from road freight decreased 8%.
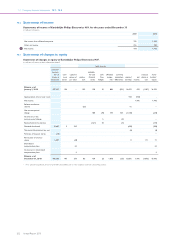
Operational carbon footprint for logistics
in kilotons CO2-equivalent
2007 2008 2009 2010
Air transport 338 301 293 337
Road transport 205 211 175 160
Sea transport 172 192 146 167
Total Philips Group 715 704 614 664
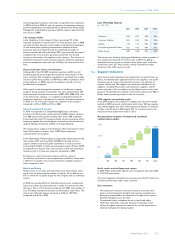
For comparison purposes, the most relevant ratios for CO2 emissions
and energy efficiency are provided below. We reduced CO2 emissions
by 7%. Additionally, our energy efficiency – expressed in terajoules per
million EUR sales – improved 6%, because of the increased sales and
continued focus on operational excellence and efficiency
improvements.
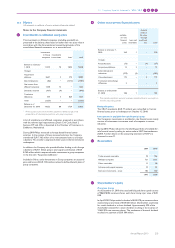
Ratios on carbon emissions and energy use
2007 2008 2009 2010
Operational CO2 emissions in
kilotons CO2-equivalent 2,157 2,144 1,937 1,808
Operational CO2 efficiency in tons
CO2-equivalent per million euro
sales 80 81 84 76
Operational energy use in terajoules 34,662 34,476 31,211 32,076
Operational energy efficiency in
terajoules per million euro sales 1.29 1.31 1.35 1.26
15.4 Green Manufacturing 2015
In 2010, we decided to group all activities related to improving the
environmental performance of our manufacturing facilities (including
chemicals management) under the Green Manufacturing 2015 program.
The program focuses on most contributors to climate change, but also
addresses water, recycling of waste, chemical substances, and will run in
parallel with EcoVision4 and 5.