Philips 2010 Annual Report Download - page 186
Download and view the complete annual report
Please find page 186 of the 2010 Philips annual report below. You can navigate through the pages in the report by either clicking on the pages listed below, or by using the keyword search tool below to find specific information within the annual report.-
 1
1 -
2
-
3
-
4
-
5
-
6
-
7
-
8
-
9
-
10
-
11
-
12
-
13
-
14
-
15
-
16
-
17
-
18
-
19
-
20
-
21
-
22
-
23
-
24
-
25
-
26
-
27
-
28
-
29
-
30
-
31
-
32
-
33
-
34
-
35
-
36
-
37
-
38
-
39
-
40
-
41
-
42
-
43
-
44
-
45
-
46
-
47
-
48
-
49
-
50
-
51
-
52
-
53
-
54
-
55
-
56
-
57
-
58
-
59
-
60
-
61
-
62
-
63
-
64
-
65
-
66
-
67
-
68
-
69
-
70
-
71
-
72
-
73
-
74
-
75
-
76
-
77
-
78
-
79
-
80
-
81
-
82
-
83
-
84
-
85
-
86
-
87
-
88
-
89
-
90
-
91
-
92
-
93
-
94
-
95
-
96
-
97
-
98
-
99
-
100
-
101
-
102
-
103
-
104
-
105
-
106
-
107
-
108
-
109
-
110
-
111
-
112
-
113
-
114
-
115
-
116
-
117
-
118
-
119
-
120
-
121
-
122
-
123
-
124
-
125
-
126
-
127
-
128
-
129
-
130
-
131
-
132
-
133
-
134
-
135
-
136
-
137
-
138
-
139
-
140
-
141
-
142
-
143
-
144
-
145
-
146
-
147
-
148
-
149
-
150
-
151
-
152
-
153
-
154
-
155
-
156
-
157
-
158
-
159
-
160
-
161
-
162
-
163
-
164
-
165
-
166
-
167
-
168
-
169
-
170
-
171
-
172
-
173
-
174
-
175
-
 176
176 -
 177
177 -
 178
178 -
 179
179 -
 180
180 -
 181
181 -
 182
182 -
 183
183 -
 184
184 -
 185
185 -
 186
186 -
 187
187 -
 188
188 -
 189
189 -
 190
190 -
 191
191 -
 192
192 -
 193
193 -
 194
194 -
 195
195 -
 196
196 -
197
-
198
-
199
-
200
-
201
-
202
-
203
-
204
-
205
-
206
-
207
-
208
-
209
-
210
-
211
-
212
-
213
-
214
-
215
-
216
-
217
-
218
-
219
-
220
-
221
-
222
-
223
-
224
-
225
-
226
-
227
-
228
-
229
-
230
-
231
-
232
-
233
-
234
-
235
-
236
-
237
-
238
-
239
-
240
-
241
-
242
-
243
-
244
-
245
-
246
-
247
-
248
-
249
-
250
 |
 |

13 Group financial statements 13.11 - 13.11
186 Annual Report 2010
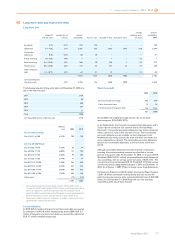
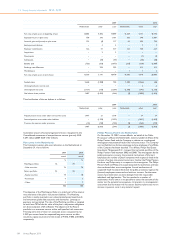
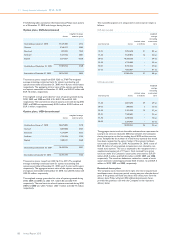
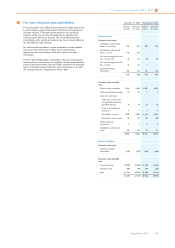
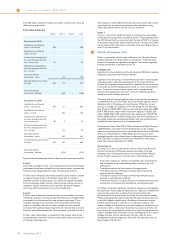
The weighted averages of the assumptions used to calculate the
defined-benefit obligations as of December 31 were as follows:
2009 2010
Netherlands other Netherlands other
Discount rate 5.0% 5.7% 4.7% 5.3%
Rate of
compensation
increase * 4.1% * 4.0%
The weighted averages of the assumptions used to calculate the net
periodic pension cost for years ended December 31:
2009 2010
Netherlands other Netherlands other
Discount rate 5.3% 6.0% 5.0% 5.7%
Expected returns on
plan assets 5.9% 6.8% 5.7% 6.5%
Rate of
compensation
increase * 3.4% * 4.1%
* The rate of compensation increase for the Netherlands consists of a general
compensation increase and an individual salary increase based on merit, seniority
and promotion. The average individual salary increase for all active participants for
the remaining working lifetime is 0.75% annually. The assumed rate of general
compensation increase for the Netherlands for calculating the projected benefit
obligations amounts to 2.0% (2009: 2.0%). The indexation assumption used to
calculate the projected benefit obligations for the Netherlands is 1.0% (2009: 1.0%).
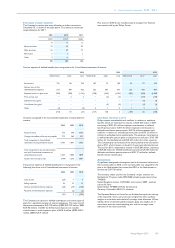
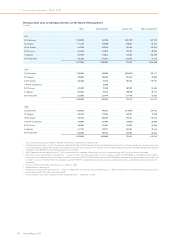
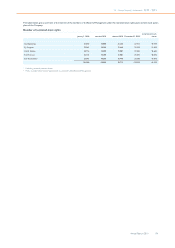
Historical data
2006 2007 2008 2009 2010
Present value of defined-
benefit obligations 20,410 18,679 16,846 17,720 20,166
Fair value of plan assets 21,352 20,200 17,899 18,470 20,080
Surplus 942 1,521 1,053 750 (86)
Experience adjustments in
% on:
- defined-benefit
obligations (gain) loss (0.9%) (0.8%) 1.2% (0.9%) 0.8%
- fair value of plan assets
(gain) loss 0.8% 2.8% 10.9% (0.6%) (3.6%)
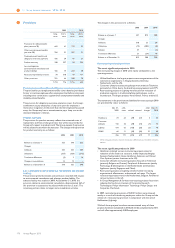
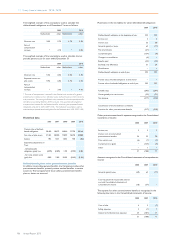
Defined-benefit plans: other postretirement benefits
In addition to providing pension benefits, the Company provides other
postretirement benefits, primarily retiree medical benefits, in certain
countries. The Company funds those other postretirement benefit
plans as claims are incurred.
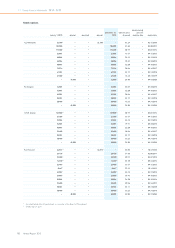
Movements in the net liability for other defined-benefit obligations:
2009 2010
Defined-benefit obligation at the beginning of year 353 295
Service cost 2 2
Interest cost 32 20
Actuarial (gains) or losses 63 (11)
Plan amendments (21) −
Curtailment gains (134) (9)
Changes in consolidation (6) −
Benefits paid (25) (25)
Exchange rate differences 31 24
Miscellaneous − 1
Defined-benefit obligation at end of year 295 297
Present value of funded obligations at end of year − −
Present value of unfunded obligations at end of year 295 297
Funded status (295) (297)
Unrecognized prior-service cost (22) (21)
Net balances (317) (318)
Classification of the net balance is as follows:
Provision for other postretirement benefits (317) (318)
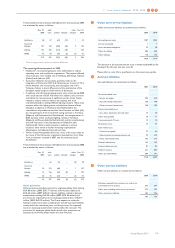
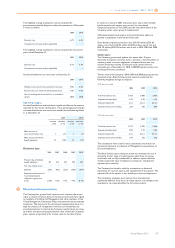
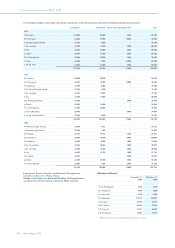
Other postretirement benefit expense recognized in the Consolidated
statements of income:
2008 2009 2010
Service cost 3 2 2
Interest cost on accumulated
postretirement benefits 34 32 20
Prior-service cost (6) (1) (2)
Curtailment loss (gain) − (134) (9)
Other − 1 −
31 (100) 11
Amounts recognized in the Consolidated statements of comprehensive
income:
2008 2009 2010
Actuarial (gains) losses (49) 63 (11)
Total recognized in net periodic pension
cost and Consolidated statements of
comprehensive income (18) (37) −
The expense for other postretirement benefits is recognized in the
following line items in the Consolidated statements of income:
2008 2009 2010
Cost of sales 4 2 (7)
Selling expenses 3 (1) 1
General and administrative expenses 24 (101) 17
31 (100) 11