Philips 2010 Annual Report Download - page 233
Download and view the complete annual report
Please find page 233 of the 2010 Philips annual report below. You can navigate through the pages in the report by either clicking on the pages listed below, or by using the keyword search tool below to find specific information within the annual report.-
 1
1 -
2
-
3
-
4
-
5
-
6
-
7
-
8
-
9
-
10
-
11
-
12
-
13
-
14
-
15
-
16
-
17
-
18
-
19
-
20
-
21
-
22
-
23
-
24
-
25
-
26
-
27
-
28
-
29
-
30
-
31
-
32
-
33
-
34
-
35
-
36
-
37
-
38
-
39
-
40
-
41
-
42
-
43
-
44
-
45
-
46
-
47
-
48
-
49
-
50
-
51
-
52
-
53
-
54
-
55
-
56
-
57
-
58
-
59
-
60
-
61
-
62
-
63
-
64
-
65
-
66
-
67
-
68
-
69
-
70
-
71
-
72
-
73
-
74
-
75
-
76
-
77
-
78
-
79
-
80
-
81
-
82
-
83
-
84
-
85
-
86
-
87
-
88
-
89
-
90
-
91
-
92
-
93
-
94
-
95
-
96
-
97
-
98
-
99
-
100
-
101
-
102
-
103
-
104
-
105
-
106
-
107
-
108
-
109
-
110
-
111
-
112
-
113
-
114
-
115
-
116
-
117
-
118
-
119
-
120
-
121
-
122
-
123
-
124
-
125
-
126
-
127
-
128
-
129
-
130
-
131
-
132
-
133
-
134
-
135
-
136
-
137
-
138
-
139
-
140
-
141
-
142
-
143
-
144
-
145
-
146
-
147
-
148
-
149
-
150
-
151
-
152
-
153
-
154
-
155
-
156
-
157
-
158
-
159
-
160
-
161
-
162
-
163
-
164
-
165
-
166
-
167
-
168
-
169
-
170
-
171
-
172
-
173
-
174
-
175
-
176
-
177
-
178
-
179
-
180
-
181
-
182
-
183
-
184
-
185
-
186
-
187
-
188
-
189
-
190
-
191
-
192
-
193
-
194
-
195
-
196
-
197
-
198
-
199
-
200
-
201
-
202
-
203
-
204
-
205
-
206
-
207
-
208
-
209
-
210
-
211
-
212
-
213
-
214
-
215
-
216
-
217
-
218
-
219
-
220
-
221
-
222
-
 223
223 -
 224
224 -
 225
225 -
 226
226 -
 227
227 -
 228
228 -
 229
229 -
 230
230 -
 231
231 -
 232
232 -
 233
233 -
 234
234 -
 235
235 -
 236
236 -
 237
237 -
 238
238 -
 239
239 -
 240
240 -
 241
241 -
 242
242 -
 243
243 -
244
-
245
-
246
-
247
-
248
-
249
-
250
 |
 |

17 Five-year overview 17 - 17
Annual Report 2010 233
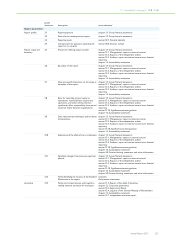
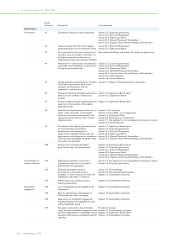
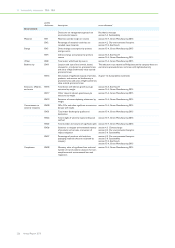
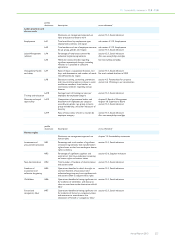
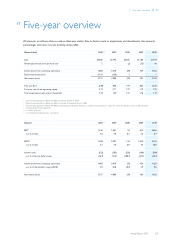
17 Five-year overview
All amounts in millions of euros unless otherwise stated. Due to factors such as acquisitions and divestments, the amounts,
percentages and ratios are not directly comparable.
General data 20061,2,3) 20073) 2008 2009 2010
Sales 26,682 26,793 26,385 23,189 25,419
Percentage increase over previous year 5 − (2) (12) 10
Income (loss) from continuing operations 1,003 5,018 (95) 424 1,452
Discontinued operations 4,154 (138) 3 − −
Net income (loss) 5,157 4,880 (92) 424 1,452
Free cash flow (348) 824 773 863 1,333
Turnover rate of net operating capital 3.73 2.71 1.72 1.79 1.91
Total employees at year-end (in thousands) 1224) 1244) 121 116 119
1) Discontinued operations reflects the effect of the sale of MDS in 2006
2) Discontinued operations reflects the effect of the sale of Semiconductors in 2006
3) Discontinued operations reflects the effect of classifying the MedQuist business as a discontinued operation in 2007, for which the previous year has been restated
4) Including discontinued operations
5) In millions of shares
6) In manufacturing excluding new acquisitions
Income 20061,2,3) 20073) 2008 2009 2010
EBIT 1,336 1,867 54 614 2,065
as a % of sales 5.0 7.0 0.2 2.6 8.1
EBITA 1,528 2,094 744 1,050 2,552
as a % of sales 5.7 7.8 2.8 4.5 10.0
Income taxes (223) (582) (256) (100) (509)
as a % of income before taxes (16.3) (12.3) (180.2) (22.3) (26.2)
Income (loss) from continuing operations 1,003 5,018 (95) 424 1,452
as a % of shareholders’ equity (ROE) 4.8 22.8 (0.5) 2.9 9.6
Net income (loss) 5,157 4,880 (92) 424 1,452