Philips 2010 Annual Report Download - page 242
Download and view the complete annual report
Please find page 242 of the 2010 Philips annual report below. You can navigate through the pages in the report by either clicking on the pages listed below, or by using the keyword search tool below to find specific information within the annual report.-
 1
1 -
2
-
3
-
4
-
5
-
6
-
7
-
8
-
9
-
10
-
11
-
12
-
13
-
14
-
15
-
16
-
17
-
18
-
19
-
20
-
21
-
22
-
23
-
24
-
25
-
26
-
27
-
28
-
29
-
30
-
31
-
32
-
33
-
34
-
35
-
36
-
37
-
38
-
39
-
40
-
41
-
42
-
43
-
44
-
45
-
46
-
47
-
48
-
49
-
50
-
51
-
52
-
53
-
54
-
55
-
56
-
57
-
58
-
59
-
60
-
61
-
62
-
63
-
64
-
65
-
66
-
67
-
68
-
69
-
70
-
71
-
72
-
73
-
74
-
75
-
76
-
77
-
78
-
79
-
80
-
81
-
82
-
83
-
84
-
85
-
86
-
87
-
88
-
89
-
90
-
91
-
92
-
93
-
94
-
95
-
96
-
97
-
98
-
99
-
100
-
101
-
102
-
103
-
104
-
105
-
106
-
107
-
108
-
109
-
110
-
111
-
112
-
113
-
114
-
115
-
116
-
117
-
118
-
119
-
120
-
121
-
122
-
123
-
124
-
125
-
126
-
127
-
128
-
129
-
130
-
131
-
132
-
133
-
134
-
135
-
136
-
137
-
138
-
139
-
140
-
141
-
142
-
143
-
144
-
145
-
146
-
147
-
148
-
149
-
150
-
151
-
152
-
153
-
154
-
155
-
156
-
157
-
158
-
159
-
160
-
161
-
162
-
163
-
164
-
165
-
166
-
167
-
168
-
169
-
170
-
171
-
172
-
173
-
174
-
175
-
176
-
177
-
178
-
179
-
180
-
181
-
182
-
183
-
184
-
185
-
186
-
187
-
188
-
189
-
190
-
191
-
192
-
193
-
194
-
195
-
196
-
197
-
198
-
199
-
200
-
201
-
202
-
203
-
204
-
205
-
206
-
207
-
208
-
209
-
210
-
211
-
212
-
213
-
214
-
215
-
216
-
217
-
218
-
219
-
220
-
221
-
222
-
223
-
224
-
225
-
226
-
227
-
228
-
229
-
230
-
231
-
 232
232 -
 233
233 -
 234
234 -
 235
235 -
 236
236 -
 237
237 -
 238
238 -
 239
239 -
 240
240 -
 241
241 -
 242
242 -
 243
243 -
 244
244 -
 245
245 -
 246
246 -
 247
247 -
 248
248 -
 249
249 -
 250
250
 |
 |

18 Investor Relations 18.5 - 18.5
242 Annual Report 2010
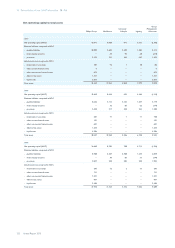
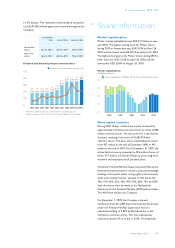
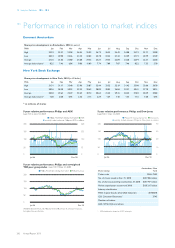
18.5 Performance in relation to market indices
Euronext Amsterdam
Share price development in Amsterdam, 2010 (in euros)
PHIA Jan Feb Mar Apr May Jun Jul Aug Sep Oct Nov Dec
High 22.33 22.31 25.28 26.94 25.92 26.72 26.23 24.49 24.08 24.19 23.11 23.08
Low 20.34 20.98 22.26 24.10 22.83 23.78 23.45 21.32 22.39 21.73 20.79 21.49
Average 21.25 21.60 23.80 25.08 24.53 25.21 24.53 22.84 23.28 22.94 22.31 22.58
Average daily volume* 8.25 7.46 6.84 9.80 11.09 7.74 7.09 7.07 7.46 8.32 7.33 5.70
New York Stock Exchange
Share price development in New York, 2010 (in US dollar)
PHG Jan Feb Mar Apr May Jun Jul Aug Sep Oct Nov Dec
High 31.51 31.17 33.48 35.90 33.87 32.44 33.32 32.19 31.42 33.90 32.06 30.70
Low 28.26 28.38 30.22 32.25 28.63 28.09 30.03 26.84 29.51 30.45 27.10 28.15
Average 30.30 29.64 32.29 33.69 30.72 30.65 31.43 29.41 30.43 31.83 30.49 29.82
Average daily volume* 1.00 0.68 0.93 2.50 2.15 2.29 1.64 1.10 1.55 1.16 1.00 0.95
* in millions of shares
Jan ‘06 Dec ‘10
0 0
10
30
20
40
50
150
100
200
5-year relative performance: Philips and Dow Jones
base 100 = Dec 31, 2005
Dow JonesPhilips NY closing share price
monthly traded volume in Philips on Dow Jones, in millions
Share listings Amsterdam, New
York
Ticker code PHIA, PHG
No. of shares issued at Dec. 31, 2010 EUR 986 million
No. of shares outstanding issued at Dec. 31, 2010 EUR 947 million
Market capitalization at year-end 2010 EUR 21.7 billion
Industry classification
MSCI: Capital Goods, Diversified Industrials 20105010
ICB: Consumer Electronics1) 3743
Members of indices
AEX, NYSE, DJSI, and others
1) ICB classification based on 2007 sales split