Philips 2010 Annual Report Download - page 91
Download and view the complete annual report
Please find page 91 of the 2010 Philips annual report below. You can navigate through the pages in the report by either clicking on the pages listed below, or by using the keyword search tool below to find specific information within the annual report.-
 1
1 -
2
-
3
-
4
-
5
-
6
-
7
-
8
-
9
-
10
-
11
-
12
-
13
-
14
-
15
-
16
-
17
-
18
-
19
-
20
-
21
-
22
-
23
-
24
-
25
-
26
-
27
-
28
-
29
-
30
-
31
-
32
-
33
-
34
-
35
-
36
-
37
-
38
-
39
-
40
-
41
-
42
-
43
-
44
-
45
-
46
-
47
-
48
-
49
-
50
-
51
-
52
-
53
-
54
-
55
-
56
-
57
-
58
-
59
-
60
-
61
-
62
-
63
-
64
-
65
-
66
-
67
-
68
-
69
-
70
-
71
-
72
-
73
-
74
-
75
-
76
-
77
-
78
-
79
-
80
-
 81
81 -
 82
82 -
 83
83 -
 84
84 -
 85
85 -
 86
86 -
 87
87 -
 88
88 -
 89
89 -
 90
90 -
 91
91 -
 92
92 -
 93
93 -
 94
94 -
 95
95 -
 96
96 -
 97
97 -
 98
98 -
 99
99 -
 100
100 -
 101
101 -
102
-
103
-
104
-
105
-
106
-
107
-
108
-
109
-
110
-
111
-
112
-
113
-
114
-
115
-
116
-
117
-
118
-
119
-
120
-
121
-
122
-
123
-
124
-
125
-
126
-
127
-
128
-
129
-
130
-
131
-
132
-
133
-
134
-
135
-
136
-
137
-
138
-
139
-
140
-
141
-
142
-
143
-
144
-
145
-
146
-
147
-
148
-
149
-
150
-
151
-
152
-
153
-
154
-
155
-
156
-
157
-
158
-
159
-
160
-
161
-
162
-
163
-
164
-
165
-
166
-
167
-
168
-
169
-
170
-
171
-
172
-
173
-
174
-
175
-
176
-
177
-
178
-
179
-
180
-
181
-
182
-
183
-
184
-
185
-
186
-
187
-
188
-
189
-
190
-
191
-
192
-
193
-
194
-
195
-
196
-
197
-
198
-
199
-
200
-
201
-
202
-
203
-
204
-
205
-
206
-
207
-
208
-
209
-
210
-
211
-
212
-
213
-
214
-
215
-
216
-
217
-
218
-
219
-
220
-
221
-
222
-
223
-
224
-
225
-
226
-
227
-
228
-
229
-
230
-
231
-
232
-
233
-
234
-
235
-
236
-
237
-
238
-
239
-
240
-
241
-
242
-
243
-
244
-
245
-
246
-
247
-
248
-
249
-
250
 |
 |

6 Sector performance 6.2.3 - 6.2.4
Annual Report 2010 91
• Domestic Appliances: kitchen appliances, beverages/
espresso, garment care, floor care, water, air
• Television
• Audio & Video Multimedia: home audio, home video,
home cinema sound, portable audio and video
• Accessories: on-the-go accessories, together@home
accessories, personal displays, speech processing
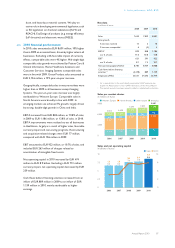
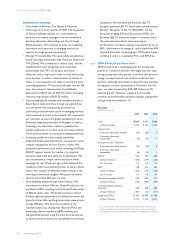
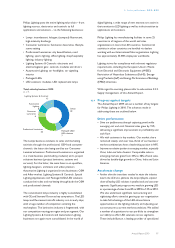
Total sales by business 2010
as a %
Health & Wellness
7
Television
36
Audio & Video Multimedia
13
Accessories
10
Other incl.
Licenses
4
Domestic
Appliances
17
Personal Care
13
We also partner with leading companies from other fields,
such as Sara Lee/Douwe Egberts and Beiersdorf (NIVEA),
in order to deliver customer-focused appliance/
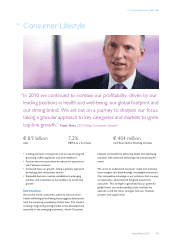
consumable combinations. Consumer Lifestyle continues
to focus on international key accounts, particularly in
emerging markets. We have pioneered innovative
approaches in online and social media to build our brand
and drive sales.
We offer a broad range of products from high to low
price/value quartiles, necessitating a diverse distribution
model. We are expanding our portfolio to increase its
accessibility, particularly for lower-tier cities in emerging
markets. We are also developing new retail channels, for
instance selling our innovative Intense Pulsed Light
depilation solution, Philips Lumea, in branches of Douglas,
the pan-European beauty retailer.
Under normal economic conditions, the Consumer
Lifestyle business experiences seasonality, with higher
sales in the fourth quarter resulting from the holiday sales.
Consumer Lifestyle employs approximately 17,700
people worldwide. Our global sales and service
organization covers more than 50 mature and emerging
markets. In addition, we operate manufacturing and
business creation organizations in the Netherlands,
France, Belgium, Austria, Hungary, Singapore, Argentina,
Brazil and China.
Consumer Lifestyle strives for full compliance with
relevant regulatory requirements.
With regard to sourcing, please refer to sub-section 5.3.3,
Supply management, of this Annual Report.
6.2.4 Progress against targets
The Annual Report 2009 set out a number of key targets
for Philips Consumer Lifestyle in 2010. The progress made
in addressing these targets is outlined below.
Drive performance
•Further increase cash flow by aggressively managing cash
targets: We strictly managed working capital, which has
been negative in many recent quarters. We effectively
managed our credit and risk, including significantly
reducing overdue customer payments. There was an
increase in the number of suppliers using supplier
finance, which reduced total cost in the supply chain. As
part of Philips’ drive to harmonize supplier terms, we
improved overall payment terms by 7 days.
•Continue to reduce fixed costs and improve the overall agility
of the cost base: We acted fast in the downturn and are
benefiting from improved gross margin and a lower cost
base, supporting year-on-year EBITA margin
improvement. We continued to manage costs via our
Earn 2 Invest Program, reinvesting savings to drive
growth.
•Strengthen excellence in execution and further develop
“sense and simplicity” as a competitive edge: We have
implemented an improved management decision
support system with granular insight into integral
performance per business, market and customer down
to product level. We are also striving to install a return
on investment (ROI) culture in order to drive, and
increase resources for, more effective advertising and
promotional campaigns.
Accelerate change
•Continually optimize the business portfolio, while prioritizing
profitable growth and success in selected new value spaces:
We have driven double-digit growth in our Health &
Wellness business and high single-digit growth in
Personal Care, as well as low single-digit growth in
Domestic Appliances. We have taken a granular
approach to ignite growth, focusing investments at a
category/country level.
•Nourish existing leadership positions, and increase
leadership positions in other categories by delighting
consumers and winning their preference: We have market
share leadership or co-leadership positions in 45% of
our businesses in emerging markets and 32% in mature
markets. We have Net Promoter Score leadership – a
key leading indicator for sales growth – in mother and
child care, power toothbrushes and male shaving and
grooming, as well as across a range of categories and
countries.