Philips 2010 Annual Report Download - page 115
Download and view the complete annual report
Please find page 115 of the 2010 Philips annual report below. You can navigate through the pages in the report by either clicking on the pages listed below, or by using the keyword search tool below to find specific information within the annual report.-
 1
1 -
2
-
3
-
4
-
5
-
6
-
7
-
8
-
9
-
10
-
11
-
12
-
13
-
14
-
15
-
16
-
17
-
18
-
19
-
20
-
21
-
22
-
23
-
24
-
25
-
26
-
27
-
28
-
29
-
30
-
31
-
32
-
33
-
34
-
35
-
36
-
37
-
38
-
39
-
40
-
41
-
42
-
43
-
44
-
45
-
46
-
47
-
48
-
49
-
50
-
51
-
52
-
53
-
54
-
55
-
56
-
57
-
58
-
59
-
60
-
61
-
62
-
63
-
64
-
65
-
66
-
67
-
68
-
69
-
70
-
71
-
72
-
73
-
74
-
75
-
76
-
77
-
78
-
79
-
80
-
81
-
82
-
83
-
84
-
85
-
86
-
87
-
88
-
89
-
90
-
91
-
92
-
93
-
94
-
95
-
96
-
97
-
98
-
99
-
100
-
101
-
102
-
103
-
104
-
 105
105 -
 106
106 -
 107
107 -
 108
108 -
 109
109 -
 110
110 -
 111
111 -
 112
112 -
 113
113 -
 114
114 -
 115
115 -
 116
116 -
 117
117 -
 118
118 -
 119
119 -
 120
120 -
 121
121 -
 122
122 -
 123
123 -
 124
124 -
 125
125 -
126
-
127
-
128
-
129
-
130
-
131
-
132
-
133
-
134
-
135
-
136
-
137
-
138
-
139
-
140
-
141
-
142
-
143
-
144
-
145
-
146
-
147
-
148
-
149
-
150
-
151
-
152
-
153
-
154
-
155
-
156
-
157
-
158
-
159
-
160
-
161
-
162
-
163
-
164
-
165
-
166
-
167
-
168
-
169
-
170
-
171
-
172
-
173
-
174
-
175
-
176
-
177
-
178
-
179
-
180
-
181
-
182
-
183
-
184
-
185
-
186
-
187
-
188
-
189
-
190
-
191
-
192
-
193
-
194
-
195
-
196
-
197
-
198
-
199
-
200
-
201
-
202
-
203
-
204
-
205
-
206
-
207
-
208
-
209
-
210
-
211
-
212
-
213
-
214
-
215
-
216
-
217
-
218
-
219
-
220
-
221
-
222
-
223
-
224
-
225
-
226
-
227
-
228
-
229
-
230
-
231
-
232
-
233
-
234
-
235
-
236
-
237
-
238
-
239
-
240
-
241
-
242
-
243
-
244
-
245
-
246
-
247
-
248
-
249
-
250
 |
 |
7 Risk management 7.6 - 7.6
Annual Report 2010 115
exposure to equity is dominated by the NXP equity stake
which was sold to the UK pension plan as part of the
recovery plan.
Although a liability-driven investment strategy has been
implemented for the US pension plans, the Funded Status
for these plans still shows a significant exposure to
interest rates changes. These US plans also show
sensitivity to equity returns.
The German pension plans are the smallest of the four
main countries, which is also reflected in the sensitivity of
the DBO. The majority of these pension plans are book
reserved and therefore the German pension plans are
only partially funded. As a result, most of the DBO
sensitivity directly translates into Funded Status
sensitivity.
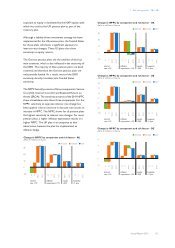
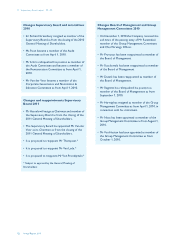
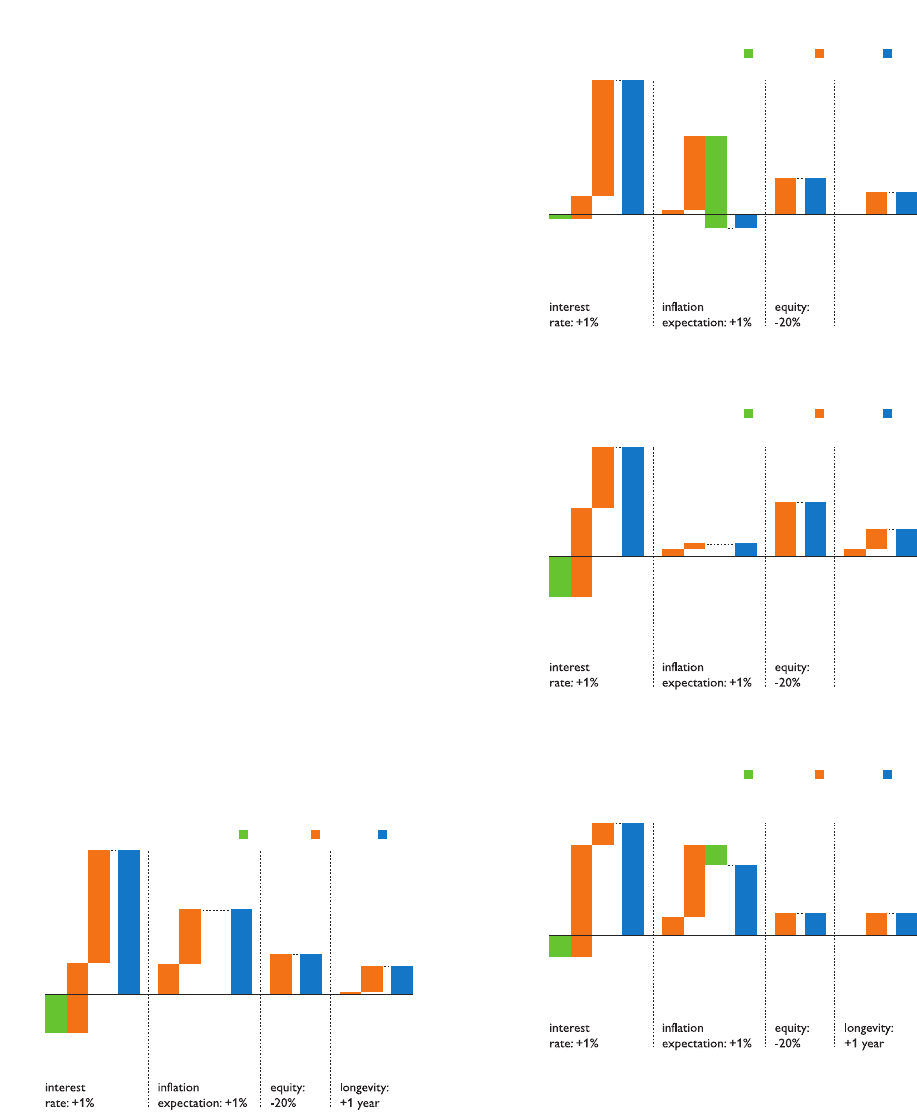
The NPPC basically consists of three components: Service
Cost (SC), Interest Cost (IC) and Expected Return on
Assets (EROA). The sensitivity analyses of the 2011 NPPC
show a breakdown into these three components. For the
NPPC sensitivity an opposite interest rate change has
been applied, since an increase in discount rate causes an
increase in NPPC. The NPPC shows for all pension plans
the highest sensitivity to interest rate changes. For most
pension plans, a higher inflation expectation results in a
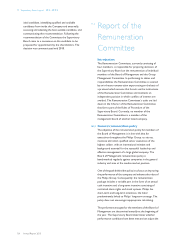
higher NPPC. The UK plan is an exception to that
observation, because the plan has implemented an
inflation hedge.
SC
EROA
NPPC
IC
EROA
NPPC
SC
EROA
NPPC
IC
SC
NPPC
IC
0
(30)
90
30
60
Change in NPPC by component and risk factor - NL
delta in millions of euros
increasedecrease total
SC
EROA
NPPC
IC
EROA
NPPC
SC
EROA
NPPC
IC
SC
NPPC
IC
longevity:
+1 year
0
(10)
30
10
20
Change in NPPC by component and risk factor - UK
delta in millions of euros
increasedecrease total
SC
EROA
NPPC
IC
EROA
NPPC
SC
EROA
NPPC
IC
SC
NPPC
IC
longevity:
+1 year
0
(10)
(5)
10
15
5
20
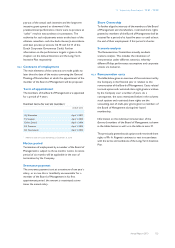
Change in NPPC by component and risk factor - US
delta in millions of euros
increasedecrease total
SC
EROA
NPPC
IC
EROA
NPPC
SC
EROA
NPPC
IC
SC
NPPC
IC
0
(2)
6
2
4
Change in NPPC by component and risk factor - DE
delta in millions of euros
increasedecrease total