Philips 2010 Annual Report Download - page 172
Download and view the complete annual report
Please find page 172 of the 2010 Philips annual report below. You can navigate through the pages in the report by either clicking on the pages listed below, or by using the keyword search tool below to find specific information within the annual report.-
 1
1 -
2
-
3
-
4
-
5
-
6
-
7
-
8
-
9
-
10
-
11
-
12
-
13
-
14
-
15
-
16
-
17
-
18
-
19
-
20
-
21
-
22
-
23
-
24
-
25
-
26
-
27
-
28
-
29
-
30
-
31
-
32
-
33
-
34
-
35
-
36
-
37
-
38
-
39
-
40
-
41
-
42
-
43
-
44
-
45
-
46
-
47
-
48
-
49
-
50
-
51
-
52
-
53
-
54
-
55
-
56
-
57
-
58
-
59
-
60
-
61
-
62
-
63
-
64
-
65
-
66
-
67
-
68
-
69
-
70
-
71
-
72
-
73
-
74
-
75
-
76
-
77
-
78
-
79
-
80
-
81
-
82
-
83
-
84
-
85
-
86
-
87
-
88
-
89
-
90
-
91
-
92
-
93
-
94
-
95
-
96
-
97
-
98
-
99
-
100
-
101
-
102
-
103
-
104
-
105
-
106
-
107
-
108
-
109
-
110
-
111
-
112
-
113
-
114
-
115
-
116
-
117
-
118
-
119
-
120
-
121
-
122
-
123
-
124
-
125
-
126
-
127
-
128
-
129
-
130
-
131
-
132
-
133
-
134
-
135
-
136
-
137
-
138
-
139
-
140
-
141
-
142
-
143
-
144
-
145
-
146
-
147
-
148
-
149
-
150
-
151
-
152
-
153
-
154
-
155
-
156
-
157
-
158
-
159
-
160
-
161
-
 162
162 -
 163
163 -
 164
164 -
 165
165 -
 166
166 -
 167
167 -
 168
168 -
 169
169 -
 170
170 -
 171
171 -
 172
172 -
 173
173 -
 174
174 -
 175
175 -
 176
176 -
 177
177 -
 178
178 -
 179
179 -
 180
180 -
 181
181 -
 182
182 -
183
-
184
-
185
-
186
-
187
-
188
-
189
-
190
-
191
-
192
-
193
-
194
-
195
-
196
-
197
-
198
-
199
-
200
-
201
-
202
-
203
-
204
-
205
-
206
-
207
-
208
-
209
-
210
-
211
-
212
-
213
-
214
-
215
-
216
-
217
-
218
-
219
-
220
-
221
-
222
-
223
-
224
-
225
-
226
-
227
-
228
-
229
-
230
-
231
-
232
-
233
-
234
-
235
-
236
-
237
-
238
-
239
-
240
-
241
-
242
-
243
-
244
-
245
-
246
-
247
-
248
-
249
-
250
 |
 |

8 13 Group financial statements 13.11 - 13.11
172 Annual Report 2010
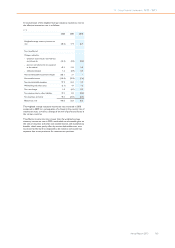
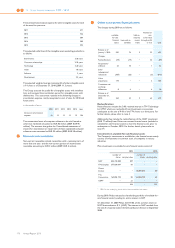
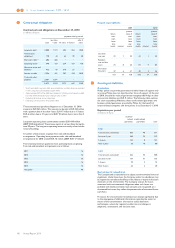
8Goodwill
The changes in 2009 and 2010 were as follows:
2009 2010
Balance as of January 1:
Cost 7,952 8,021
Amortization / Impairments (672) (659)
Book value 7,280 7,362
Changes in book value:
Acquisitions 149 84
Impairments − −
Translation differences (67) 589
Balance as of December 31:
Cost 8,021 8,742
Amortization / Impairments (659) (707)
Book value 7,362 8,035
Acquisitions in 2010 include goodwill related to the acquisition of
Discus Holdings, Inc. for EUR 47 million and several other companies. In
addition, goodwill changed due to the finalization of purchase price
accounting related to acquisitions in the prior year.
Acquisitions in 2009 include goodwill related to the acquisition of Saeco
for EUR 80 million and several other companies. In addition, goodwill
changed due to the finalization of purchase price accounting related to
acquisitions in the prior year.
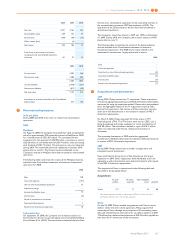
For impairment testing, goodwill is allocated to (groups of) cash-
generating units (typically one level below operating sector level), which
represent the lowest level at which the goodwill is monitored internally
for management purposes.
In 2010, the organizational structure of the Healthcare sector was
changed. As a result of the change, part of the goodwill of Clinical Care
Systems was allocated to Imaging Systems and the other part to Patient
Care & Clinical Informatics (former Healthcare Informatics).
Furthermore, Respiratory Hospital and related goodwill were
transferred to Patient Care & Clinical Informatics.
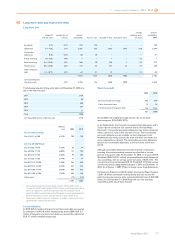
Goodwill allocated to the cash generating units Respiratory Care and
Sleep Management, Professional Luminaires, Imaging Systems and
Patient Care & Clinical Informatics is considered to be significant in
comparison to the total book value of goodwill for the Group at
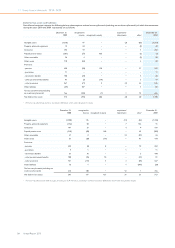
December 31, 2010. The amounts allocated are presented below. Last
year’s amounts are based on the revised 2010 structure for the
Healthcare sector:
2009 2010
Respiratory Care and Sleep Management 1,995 2,209
Professional Luminaires 1,408 1,485
Imaging Systems 1,316 1,422
Patient Care & Clinical Informatics 1,189 1,297
The basis of the recoverable amount used in the annual (performed in
the second quarter) and trigger-based impairment tests is the value in
use. Key assumptions used in the impairment tests for the units in the
table above were sales growth rates, adjusted income from operations
and the rates used for discounting the projected cash flows. These cash
flow projections were determined using management’s internal
forecasts that cover an initial period from 2010 to 2015 that matches
the period used for our strategic review. For the 2009 test, a shorter
initial forecast period was used. Projections were extrapolated with
stable or declining growth rates for a period of 5 years, after which a
terminal value was calculated. For terminal value calculation, growth
rates were capped at a historical long term average growth rate.
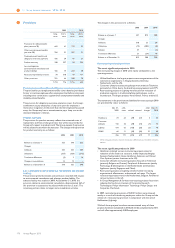
The sales growth rates and margins used to estimate cash flows were
based on past performance, external market growth assumptions and
industry long-term growth averages.
Adjusted income from operations in all units is expected to increase
over the projection period as a result of volume growth and cost
efficiencies.
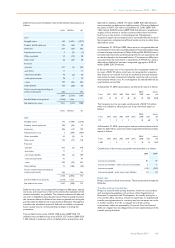
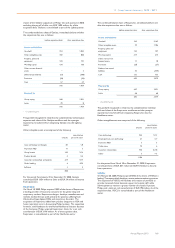
Cash flow projections of Respiratory Care and Sleep Management,
Professional Luminaires, Imaging Systems and Patient Care & Clinical
Informatics for 2010 were based on the following key assumptions
(based on the annual impairment test performed in Q2):
in %
compound sales growth rate1)
initial
forecast
period
extra-
polation
period terminal
value
pre-tax
discount
rates
Respiratory Care and Sleep
Management 9.4 5.0 2.7 10.2
Professional Luminaires 11.3 7.2 2.7 14.0
Imaging Systems 5.2 4.0 2.7 11.1
Patient Care & Clinical
Informatics 6.5 5.4 2.7 12.1
1) Compound sales growth rate is the annualized steady growth rate over the
forecast period
The assumptions used for the 2009 cash flow projections, based on the
2009 organizational structure of the Healthcare sector, were as follows:
in %
compound sales growth rate1)
forecast
period
extra-
polation
period terminal
value
pre-tax
discount
rates
Respiratory Care and Sleep
Management 9.4 4.2 2.7 10.4
Professional Luminaires 8.0 4.9 2.7 14.0
Imaging Systems 3.8 3.0 2.7 10.0
1) Compound sales growth rate is the annualized steady growth rate over the
forecast period
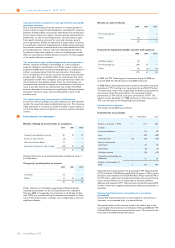
These assumptions were based on the 2009 annual impairment test
performed in the second quarter of last year, except for Respiratory
Care and Sleep Management for which the figures were based on the
Q4 test.
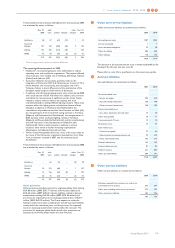
Based on the annual test in 2010 the recoverable amounts of the cash
generating units were estimated to be higher than the carrying amounts,
and management therefore did not identify any impairments.
Among the mentioned units, Respiratory Care and Sleep Management
and Professional Luminaires have the highest amount of goodwill and
the lowest excess of the recoverable amount over the carrying amount.
The headroom of Respiratory Care and Sleep Management was
estimated at EUR 100 million, the headroom of Professional Luminaires
at EUR 600 million.