Philips 2010 Annual Report Download - page 232
Download and view the complete annual report
Please find page 232 of the 2010 Philips annual report below. You can navigate through the pages in the report by either clicking on the pages listed below, or by using the keyword search tool below to find specific information within the annual report.-
 1
1 -
2
-
3
-
4
-
5
-
6
-
7
-
8
-
9
-
10
-
11
-
12
-
13
-
14
-
15
-
16
-
17
-
18
-
19
-
20
-
21
-
22
-
23
-
24
-
25
-
26
-
27
-
28
-
29
-
30
-
31
-
32
-
33
-
34
-
35
-
36
-
37
-
38
-
39
-
40
-
41
-
42
-
43
-
44
-
45
-
46
-
47
-
48
-
49
-
50
-
51
-
52
-
53
-
54
-
55
-
56
-
57
-
58
-
59
-
60
-
61
-
62
-
63
-
64
-
65
-
66
-
67
-
68
-
69
-
70
-
71
-
72
-
73
-
74
-
75
-
76
-
77
-
78
-
79
-
80
-
81
-
82
-
83
-
84
-
85
-
86
-
87
-
88
-
89
-
90
-
91
-
92
-
93
-
94
-
95
-
96
-
97
-
98
-
99
-
100
-
101
-
102
-
103
-
104
-
105
-
106
-
107
-
108
-
109
-
110
-
111
-
112
-
113
-
114
-
115
-
116
-
117
-
118
-
119
-
120
-
121
-
122
-
123
-
124
-
125
-
126
-
127
-
128
-
129
-
130
-
131
-
132
-
133
-
134
-
135
-
136
-
137
-
138
-
139
-
140
-
141
-
142
-
143
-
144
-
145
-
146
-
147
-
148
-
149
-
150
-
151
-
152
-
153
-
154
-
155
-
156
-
157
-
158
-
159
-
160
-
161
-
162
-
163
-
164
-
165
-
166
-
167
-
168
-
169
-
170
-
171
-
172
-
173
-
174
-
175
-
176
-
177
-
178
-
179
-
180
-
181
-
182
-
183
-
184
-
185
-
186
-
187
-
188
-
189
-
190
-
191
-
192
-
193
-
194
-
195
-
196
-
197
-
198
-
199
-
200
-
201
-
202
-
203
-
204
-
205
-
206
-
207
-
208
-
209
-
210
-
211
-
212
-
213
-
214
-
215
-
216
-
217
-
218
-
219
-
220
-
221
-
 222
222 -
 223
223 -
 224
224 -
 225
225 -
 226
226 -
 227
227 -
 228
228 -
 229
229 -
 230
230 -
 231
231 -
 232
232 -
 233
233 -
 234
234 -
 235
235 -
 236
236 -
 237
237 -
 238
238 -
 239
239 -
 240
240 -
 241
241 -
 242
242 -
243
-
244
-
245
-
246
-
247
-
248
-
249
-
250
 |
 |

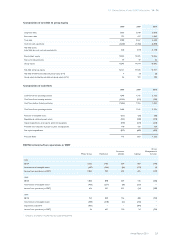
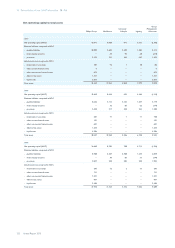
16 Reconciliation of non-GAAP information 16 - 16
232 Annual Report 2010
Net operating capital to total assets
Philips Group Healthcare Consumer
Lifestyle Lighting
Group
Management
& Services
2010
Net operating capital (NOC) 12,071 8,908 911 5,561 (3,309)
Eliminate liabilities comprised in NOC:
- payables/liabilities 10,009 2,603 2,509 1,485 3,412
- intercompany accounts − 54 95 68 (217)
- provisions 2,339 321 342 247 1,429
Include assets not comprised in NOC:
- investments in associates 181 76 1 18 86
- other current financial assets 6 − − − 6
- other non-current financial assets 479 − − − 479
- deferred tax assets 1,351 − − − 1,351
- liquid assets 5,833 − − − 5,833
Total assets 32,269 11,962 3,858 7,379 9,070
2009
Net operating capital (NOC) 12,649 8,434 625 5,104 (1,514)
Eliminate liabilities comprised in NOC:
- payables/liabilities 8,636 2,115 2,155 1,247 3,119
- intercompany accounts − 32 85 62 (179)
- provisions 2,450 317 420 324 1,389
Include assets not comprised in NOC:
- investments in associates 281 71 1 11 198
- other current financial assets 191 − − − 191
- other non-current financial assets 691 − − − 691
- deferred tax assets 1,243 − − − 1,243
- liquid assets 4,386 − − − 4,386
Total assets 30,527 10,969 3,286 6,748 9,524
2008
Net operating capital (NOC) 14,069 8,785 798 5,712 (1,226)
Eliminate liabilities comprised in NOC:
- payables/ liabilities 8,708 2,207 2,408 1,234 2,859
- intercompany accounts − 30 83 31 (144)
- provisions 2,837 329 285 229 1,994
Include assets not comprised in NOC:
- investments in associates 293 72 2 16 203
- other current financial assets 121 − − − 121
- other non-current financial assets 1,331 − − − 1,331
- deferred tax assets 931 − − − 931
- liquid assets 3,620 − − − 3,620
Total assets 31,910 11,423 3,576 7,222 9,689