Philips 2010 Annual Report Download - page 214
Download and view the complete annual report
Please find page 214 of the 2010 Philips annual report below. You can navigate through the pages in the report by either clicking on the pages listed below, or by using the keyword search tool below to find specific information within the annual report.-
 1
1 -
2
-
3
-
4
-
5
-
6
-
7
-
8
-
9
-
10
-
11
-
12
-
13
-
14
-
15
-
16
-
17
-
18
-
19
-
20
-
21
-
22
-
23
-
24
-
25
-
26
-
27
-
28
-
29
-
30
-
31
-
32
-
33
-
34
-
35
-
36
-
37
-
38
-
39
-
40
-
41
-
42
-
43
-
44
-
45
-
46
-
47
-
48
-
49
-
50
-
51
-
52
-
53
-
54
-
55
-
56
-
57
-
58
-
59
-
60
-
61
-
62
-
63
-
64
-
65
-
66
-
67
-
68
-
69
-
70
-
71
-
72
-
73
-
74
-
75
-
76
-
77
-
78
-
79
-
80
-
81
-
82
-
83
-
84
-
85
-
86
-
87
-
88
-
89
-
90
-
91
-
92
-
93
-
94
-
95
-
96
-
97
-
98
-
99
-
100
-
101
-
102
-
103
-
104
-
105
-
106
-
107
-
108
-
109
-
110
-
111
-
112
-
113
-
114
-
115
-
116
-
117
-
118
-
119
-
120
-
121
-
122
-
123
-
124
-
125
-
126
-
127
-
128
-
129
-
130
-
131
-
132
-
133
-
134
-
135
-
136
-
137
-
138
-
139
-
140
-
141
-
142
-
143
-
144
-
145
-
146
-
147
-
148
-
149
-
150
-
151
-
152
-
153
-
154
-
155
-
156
-
157
-
158
-
159
-
160
-
161
-
162
-
163
-
164
-
165
-
166
-
167
-
168
-
169
-
170
-
171
-
172
-
173
-
174
-
175
-
176
-
177
-
178
-
179
-
180
-
181
-
182
-
183
-
184
-
185
-
186
-
187
-
188
-
189
-
190
-
191
-
192
-
193
-
194
-
195
-
196
-
197
-
198
-
199
-
200
-
201
-
202
-
203
-
 204
204 -
 205
205 -
 206
206 -
 207
207 -
 208
208 -
 209
209 -
 210
210 -
 211
211 -
 212
212 -
 213
213 -
 214
214 -
 215
215 -
 216
216 -
 217
217 -
 218
218 -
 219
219 -
 220
220 -
 221
221 -
 222
222 -
 223
223 -
 224
224 -
225
-
226
-
227
-
228
-
229
-
230
-
231
-
232
-
233
-
234
-
235
-
236
-
237
-
238
-
239
-
240
-
241
-
242
-
243
-
244
-
245
-
246
-
247
-
248
-
249
-
250
 |
 |

15 Sustainability statements 15.4 - 15.4
214 Annual Report 2010
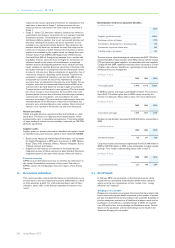
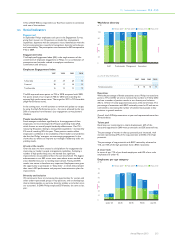
Water intake
in thousands m3
2007 2008 2009 2010
Healthcare 369 370 363 254
Consumer Lifestyle 485 452 315 351
Lighting 3,350 3,168 3,531 3,604
Group Management & Services 5 6 7 8
Philips Group 4,209 3,996 4,216 4,217
In 2010, 73% of water was purchased and 27% was extracted from
groundwater wells.
Waste in manufacturing
Total waste increased 7% to 105 kilotons in 2010 from 98 kilotons in
2009. Lighting (67%) and Consumer Lifestyle (22%) account for 89% of
our total waste. The increase was mainly caused by Lighting as a result of
higher volumes and reorganizations at glass production sites, coupled
with a new acquisition in Consumer Lifestyle.
Total waste
in kilotons
2007 2008 2009 2010
Healthcare 7.9 8.2 8.2 11.2
Consumer Lifestyle 40.4 28.0 20.1 23.2
Lighting 79.2 77.3 69.3 70.0
Group Management & Services 0.1 0.1 0.1 0.1
Philips Group 127.6 113.6 97.7 104.5
Total waste consists of waste that is delivered for landfill, incineration
or recycling. Materials delivered for recycling via an external contractor
comprised 81 kilotons, which equaled 78% of total waste. The
remaining waste consisted of 16% non-hazardous and 6% hazardous
waste.
Restricted substances
Emissions of restricted substances totaled 1,036 kilos in 2010, an
increase of 62% versus 2009. With the Green Manufacturing 2015
program we continue to focus on a selection of the most important
substances in our processes.
Restricted substances
in kilos
2007 2008 2009 2010
Benzene and Benzene compounds 52 1 136 101
Mercury and Mercury Compounds 185 211 122 83
CFCs/HCFCs1) 157 213 14 5
Other restricted substances 973 673 366 847
Total 1,367 1,098 638 1,036
1) excluding cooling systems
Benzene
Lighting is the only sector that uses benzene in manufacturing. The
decrease in 2010 was caused by portfolio changes at one of the sites.
Mercury
Mercury is used exclusively by Lighting. Emissions decreased
significantly from 122 kg in 2009 to 83 kg in 2010, due to process
improvements, reduction of mercury intense production along with
changes in the industrial footprint.
CFCs/HCFCs
In 2010 total emissions from CFCs/HCFCs reduced to 5 kg from 14 kg
due to organizational changes at a Healthcare site.
Other restricted substances
Emissions of other restricted substances totaled 847 kg in 2010, steeply
increasing from 366 kg the previous year. This increase is due to a new
acquisition in Consumer Lifestyle, mitigated by process improvements
and organizational changes at Healthcare.
Hazardous substances
For hazardous substances targets have been set on a selected number
of substances.
Hazardous substances
in kilos
2007 2008 2009 2010
Lead and lead compounds 1,838 684 1,958 108
PFCs (Per Fluorinated
Compounds) 1,534 1,858 2,535 1,507
Toluene 2,210 2,524 2,160 6,603
Xylene 4,506 3,684 4,619 30,534
Styrene 80,526 37,454 21,567 22,920
Antimony, Arsenic and their
compounds 18 16 30 24
Other hazardous substances 175 96 775 6,404
Total 90,807 46,316 33,644 68,100
Lead and lead compounds
The decrease in 2010 was mainly related to the termination of a glass
furnace operation and organizational changes in Lighting.
PFCs
The decrease in 2010 related to a deconsolidated site which applied
PFCs in Healthcare, partially offset by higher production volumes at one
Lighting site.
Toluene
The emission of toluene, mainly used in wet lacquers, increased largely
as a result of a new acquisition in Consumer Lifestyle.
Xylene
The increase was attributable to a wet lacquering process mainly
applied by a new acquisition in Consumer Lifestyle.
Styrene
The emission of styrene mainly increased due to organizational and
production portfolio changes at two Lighting sites.
Antimony, Arsenic and their compounds
Less demand for glass production at a Lighting site resulted in less
antimony emission overall in 2010 versus 2009.
Other hazardous substances
The emissions of other hazardous substances amounted to 6,404 kg in
2010, compared to 775 kg in 2009. This increase was mainly caused by a
new acquisition in Consumer Lifestyle.
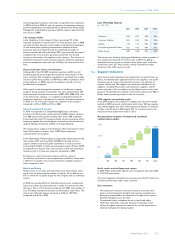
ISO 14001 certification
In 2010, 95% of reporting manufacturing sites were certified. This 3%
increase compared to the previous year can be attributed to
organizational changes and to new acquisitions being certified for the
first time this year.
ISO 14001 certification
as a % of all reporting organizations
2007 2008 2009 2010
Philips Group 90 95 92 95
Environmental Incidents
In 2010, twelve incidents were reported by Consumer Lifestyle and
Lighting in the following categories. They were related to waste (two),
water (two), restricted substances (two), hazardous substances (one),
relevant substances (two), soil (one) and fire (two).