Philips 2010 Annual Report Download - page 234
Download and view the complete annual report
Please find page 234 of the 2010 Philips annual report below. You can navigate through the pages in the report by either clicking on the pages listed below, or by using the keyword search tool below to find specific information within the annual report.-
 1
1 -
2
-
3
-
4
-
5
-
6
-
7
-
8
-
9
-
10
-
11
-
12
-
13
-
14
-
15
-
16
-
17
-
18
-
19
-
20
-
21
-
22
-
23
-
24
-
25
-
26
-
27
-
28
-
29
-
30
-
31
-
32
-
33
-
34
-
35
-
36
-
37
-
38
-
39
-
40
-
41
-
42
-
43
-
44
-
45
-
46
-
47
-
48
-
49
-
50
-
51
-
52
-
53
-
54
-
55
-
56
-
57
-
58
-
59
-
60
-
61
-
62
-
63
-
64
-
65
-
66
-
67
-
68
-
69
-
70
-
71
-
72
-
73
-
74
-
75
-
76
-
77
-
78
-
79
-
80
-
81
-
82
-
83
-
84
-
85
-
86
-
87
-
88
-
89
-
90
-
91
-
92
-
93
-
94
-
95
-
96
-
97
-
98
-
99
-
100
-
101
-
102
-
103
-
104
-
105
-
106
-
107
-
108
-
109
-
110
-
111
-
112
-
113
-
114
-
115
-
116
-
117
-
118
-
119
-
120
-
121
-
122
-
123
-
124
-
125
-
126
-
127
-
128
-
129
-
130
-
131
-
132
-
133
-
134
-
135
-
136
-
137
-
138
-
139
-
140
-
141
-
142
-
143
-
144
-
145
-
146
-
147
-
148
-
149
-
150
-
151
-
152
-
153
-
154
-
155
-
156
-
157
-
158
-
159
-
160
-
161
-
162
-
163
-
164
-
165
-
166
-
167
-
168
-
169
-
170
-
171
-
172
-
173
-
174
-
175
-
176
-
177
-
178
-
179
-
180
-
181
-
182
-
183
-
184
-
185
-
186
-
187
-
188
-
189
-
190
-
191
-
192
-
193
-
194
-
195
-
196
-
197
-
198
-
199
-
200
-
201
-
202
-
203
-
204
-
205
-
206
-
207
-
208
-
209
-
210
-
211
-
212
-
213
-
214
-
215
-
216
-
217
-
218
-
219
-
220
-
221
-
222
-
223
-
 224
224 -
 225
225 -
 226
226 -
 227
227 -
 228
228 -
 229
229 -
 230
230 -
 231
231 -
 232
232 -
 233
233 -
 234
234 -
 235
235 -
 236
236 -
 237
237 -
 238
238 -
 239
239 -
 240
240 -
 241
241 -
 242
242 -
 243
243 -
 244
244 -
245
-
246
-
247
-
248
-
249
-
250
 |
 |

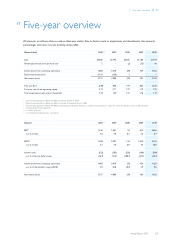
17 Five-year overview 17 - 17
234 Annual Report 2010
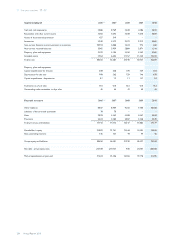
Capital employed 20061,2,3) 20073) 2008 2009 2010
Cash and cash equivalents 5,886 8,769 3,620 4,386 5,833
Receivables and other current assets 5,502 5,292 5,038 4,610 4,899
Assets of discontinued operations 427 319 − − −
Inventories 2,940 3,213 3,491 2,913 3,865
Non-current financial assets/investments in associates 10,924 5,000 1,624 972 660
Non-current receivables/assets 3,905 3,959 2,884 2,871 1,514
Property, plant and equipment 3,102 3,194 3,496 3,252 3,265
Intangible assets 5,964 6,635 11,757 11,523 12,233
Total assets 38,650 36,381 31,910 30,527 32,269
Property, plant and equipment:
Capital expenditures for the year 698 658 770 524 653
Depreciation for the year 990 562 729 746 678
Capital expenditures : depreciation 0.7 1.2 1.1 0.7 1.0
Inventories as a % of sales 11.0 12.0 13.2 12.6 15.2
Outstanding trade receivables, in days sales 45 44 42 40 46
Financial structure 20061,2,3) 20073) 2008 2009 2010
Other liabilities 8,837 8,469 9,292 9,166 10,180
Liabilities of discontinued operations 78 78 − − −
Debt 3,878 3,563 4,188 4,267 4,658
Provisions 2,623 2,403 2,837 2,450 2,339
Total provisions and liabilities 15,416 14,513 16,317 15,883 17,177
Shareholders’ equity 23,099 21,741 15,544 14,595 15,046
Non-controlling interests 135 127 49 49 46
Group equity and liabilities 38,650 36,381 31,910 30,527 32,269
Net debt : group equity ratio (9):109 (31):131 4:96 (1):101 (8):108
Market capitalization at year-end 31,624 31,436 12,765 19,170 21,705