Philips 2010 Annual Report Download - page 196
Download and view the complete annual report
Please find page 196 of the 2010 Philips annual report below. You can navigate through the pages in the report by either clicking on the pages listed below, or by using the keyword search tool below to find specific information within the annual report.-
 1
1 -
2
-
3
-
4
-
5
-
6
-
7
-
8
-
9
-
10
-
11
-
12
-
13
-
14
-
15
-
16
-
17
-
18
-
19
-
20
-
21
-
22
-
23
-
24
-
25
-
26
-
27
-
28
-
29
-
30
-
31
-
32
-
33
-
34
-
35
-
36
-
37
-
38
-
39
-
40
-
41
-
42
-
43
-
44
-
45
-
46
-
47
-
48
-
49
-
50
-
51
-
52
-
53
-
54
-
55
-
56
-
57
-
58
-
59
-
60
-
61
-
62
-
63
-
64
-
65
-
66
-
67
-
68
-
69
-
70
-
71
-
72
-
73
-
74
-
75
-
76
-
77
-
78
-
79
-
80
-
81
-
82
-
83
-
84
-
85
-
86
-
87
-
88
-
89
-
90
-
91
-
92
-
93
-
94
-
95
-
96
-
97
-
98
-
99
-
100
-
101
-
102
-
103
-
104
-
105
-
106
-
107
-
108
-
109
-
110
-
111
-
112
-
113
-
114
-
115
-
116
-
117
-
118
-
119
-
120
-
121
-
122
-
123
-
124
-
125
-
126
-
127
-
128
-
129
-
130
-
131
-
132
-
133
-
134
-
135
-
136
-
137
-
138
-
139
-
140
-
141
-
142
-
143
-
144
-
145
-
146
-
147
-
148
-
149
-
150
-
151
-
152
-
153
-
154
-
155
-
156
-
157
-
158
-
159
-
160
-
161
-
162
-
163
-
164
-
165
-
166
-
167
-
168
-
169
-
170
-
171
-
172
-
173
-
174
-
175
-
176
-
177
-
178
-
179
-
180
-
181
-
182
-
183
-
184
-
185
-
 186
186 -
 187
187 -
 188
188 -
 189
189 -
 190
190 -
 191
191 -
 192
192 -
 193
193 -
 194
194 -
 195
195 -
 196
196 -
 197
197 -
 198
198 -
 199
199 -
 200
200 -
 201
201 -
 202
202 -
 203
203 -
 204
204 -
 205
205 -
 206
206 -
207
-
208
-
209
-
210
-
211
-
212
-
213
-
214
-
215
-
216
-
217
-
218
-
219
-
220
-
221
-
222
-
223
-
224
-
225
-
226
-
227
-
228
-
229
-
230
-
231
-
232
-
233
-
234
-
235
-
236
-
237
-
238
-
239
-
240
-
241
-
242
-
243
-
244
-
245
-
246
-
247
-
248
-
249
-
250
 |
 |

33 13 Group financial statements 13.11 - 13.11
196 Annual Report 2010
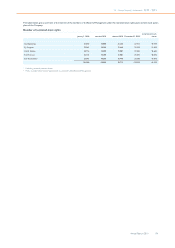
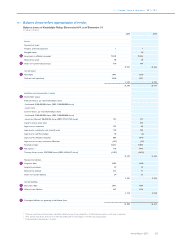
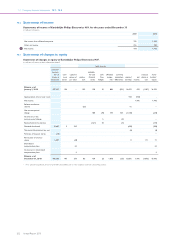
The table below analyses financial instruments carried at fair value, by
different hierarchy levels:
Fair value hierarchy
level 1 level 2 level 3 total
December 31, 2010
Available-for-sale financial
assets - non-current 298 298
Available-for-sale financial
assets - current − −
Financial assets designated at
fair value through profit and
loss - non-current 62 62
Financial asses designated at
fair value through profit and
loss - current − −
Derivative financial
instruments - assets 112 112
Total financial assets carried at
fair value 360 112 − 472
Derivative financial
instruments - liabilities (564) − (564)
December 31, 2009
Available-for-sale financial
assets - non-current 244 61 − 305
Available-for-sale financial
assets - current 145 145
Financial assets designated at
fair value through profit and
loss - non-current 30 2 32
Financial assets designated at
fair value through profit and
loss - current 25 25
Derivative financial
instruments - assets 102 102
Total financial assets carried at
fair value 274 335 − 609
Derivative financial
instruments - liabilities (276) (276)
Specific valuation techniques used to value financial instruments include:
Level 1
Instruments included in level 1 are comprised primarily of listed equity
investments classified as available-for-sale financial assets, investees and
financial assets designated at fair value through profit and loss.
The fair value of financial instruments traded in active markets is based
on quoted market prices at the balance sheet date. A market is
regarded as active if quoted prices are readily and regularly available
from an exchange, dealer, broker, industry group, pricing service, or
regulatory agency, and those prices represent actual and regularly
occurring market transactions on an arm’s length basis.
Level 2
The fair value of financial instruments that are not traded in an active
market (for example, over-the-counter derivatives or convertible bond
instruments) are determined by using valuation techniques. These
valuation techniques maximize the use of observable market data
where it is available and rely as little as possible on entity-specific
estimates. If all significant inputs required to fair value an instrument are
based on observable market data, the instrument is included in level 2.
The fair value of derivatives is calculated as the present value of the
estimated future cash flows based on observable interest yield curves
and foreign exchange rates.
The valuation of convertible bond instruments uses observable market
quoted data for the options and present value calculations using
observable yield curves for the fair value of the bonds.
Level 3
If one or more of the significant inputs are not based on observable
market data, the instrument is included in level 3. The arrangement with
the UK Pension Fund in conjunction with the sale of NXP is a financial
instrument carried at fair value classified as level 3. At the end of 2010,
the fair value of this instrument is estimated to be zero. Please refer to
note 11 for more details.
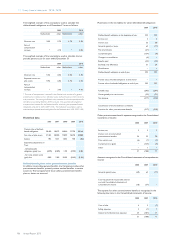
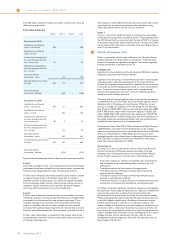
33 Details of treasury risks
Philips is exposed to several types of financial risk. This note further
analyzes financial risks. Philips does not purchase or hold derivative
financial instruments for speculative purposes. Information regarding
financial instruments is included in note 32.
Liquidity risk
Liquidity risk is the risk that an entity will encounter difficulty in meeting
obligations associated with financial liabilities.
Liquidity risk for the group is monitored through the Treasury liquidity
committee which tracks the development of the actual cash flow
position for the group and uses input from a number of sources in order
to forecast the overall liquidity position both on a short and long-term
basis. Corporate treasury invests surplus cash in money market
deposits with appropriate maturities to ensure sufficient liquidity is
available to meet liabilities when due.
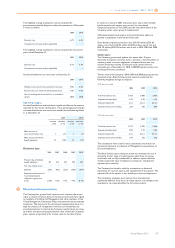
The rating of the Company’s debt by major rating services may improve
or deteriorate. As a result, Philips’ future borrowing capacity may be
influenced and its financing costs may fluctuate. Philips has various
sources to mitigate the liquidity risk for the group. At the reporting
date, Philips had EUR 5,833 million in cash and cash equivalents (2009:
EUR 4,386 million), within which short-term deposits of EUR 5,229
million (2009: EUR 3,740 million) and other liquid assets of EUR 104
million (2009: EUR 155 million). Philips pools cash from subsidiaries to
the extent legally and economically feasible; cash not pooled remains
available for local operational or investment needs.
Furthermore, Philips had a USD 2.5 billion Commercial Paper Program;
a EUR1.8 billion committed revolving facility that can be used for
general corporate purpose and a committed bilateral loan of EUR 200
million. As of December 31, 2010, Philips did not have any loans
outstanding under any of these facilities. Additionally Philips also held a
EUR 270 million of equity investments in available-for-sale financial
assets (fair value at December 31, 2010).
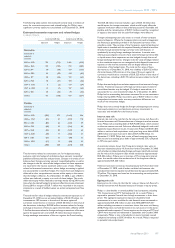
Currency risk
Currency risk is the risk that the fair value or future cash flows of a
financial instrument will fluctuate because of changes in foreign
exchange rates. Currency fluctuations may impact Philips’ financial
results. Philips is exposed to currency risk in the following areas:
• Transaction exposures, related to forecasted sales and purchases
and on-balance-sheet receivables/payables resulting from such
transactions
• Translation exposure of net income in foreign entities
• Translation exposure of foreign-currency intercompany and
external debt and deposits
• Translation exposure of foreign-currency-denominated equity
invested in consolidated companies
• Translation exposure to equity interests in non-functional-currency
investments in associates and available-for-sale financial assets.
It is Philips’ policy that significant transaction exposures are hedged by
the businesses. Accordingly, all businesses are required to identify and
measure their exposures resulting from material transactions
denominated in currencies other than their own functional currency.
Philips’ policy generally requires committed foreign currency exposures
to be fully hedged using forwards. Anticipated transactions may be
hedged using forwards or options or a combination thereof. The
amount hedged as a proportion of the total exposure identified varies
per business and is a function of the ability to project cash flows, the
time horizon for the cash flows and the way in which the businesses can
adapt to changed levels of foreign-currency exchange rates. As a result,
hedging activities will not eliminate all currency risks for these
anticipated transaction exposures. Generally, the maximum tenor of
these hedges is 18 months.