Philips 2010 Annual Report Download - page 147
Download and view the complete annual report
Please find page 147 of the 2010 Philips annual report below. You can navigate through the pages in the report by either clicking on the pages listed below, or by using the keyword search tool below to find specific information within the annual report.-
 1
1 -
2
-
3
-
4
-
5
-
6
-
7
-
8
-
9
-
10
-
11
-
12
-
13
-
14
-
15
-
16
-
17
-
18
-
19
-
20
-
21
-
22
-
23
-
24
-
25
-
26
-
27
-
28
-
29
-
30
-
31
-
32
-
33
-
34
-
35
-
36
-
37
-
38
-
39
-
40
-
41
-
42
-
43
-
44
-
45
-
46
-
47
-
48
-
49
-
50
-
51
-
52
-
53
-
54
-
55
-
56
-
57
-
58
-
59
-
60
-
61
-
62
-
63
-
64
-
65
-
66
-
67
-
68
-
69
-
70
-
71
-
72
-
73
-
74
-
75
-
76
-
77
-
78
-
79
-
80
-
81
-
82
-
83
-
84
-
85
-
86
-
87
-
88
-
89
-
90
-
91
-
92
-
93
-
94
-
95
-
96
-
97
-
98
-
99
-
100
-
101
-
102
-
103
-
104
-
105
-
106
-
107
-
108
-
109
-
110
-
111
-
112
-
113
-
114
-
115
-
116
-
117
-
118
-
119
-
120
-
121
-
122
-
123
-
124
-
125
-
126
-
127
-
128
-
129
-
130
-
131
-
132
-
133
-
134
-
135
-
136
-
 137
137 -
 138
138 -
 139
139 -
 140
140 -
 141
141 -
 142
142 -
 143
143 -
 144
144 -
 145
145 -
 146
146 -
 147
147 -
 148
148 -
 149
149 -
 150
150 -
 151
151 -
 152
152 -
 153
153 -
 154
154 -
 155
155 -
 156
156 -
 157
157 -
158
-
159
-
160
-
161
-
162
-
163
-
164
-
165
-
166
-
167
-
168
-
169
-
170
-
171
-
172
-
173
-
174
-
175
-
176
-
177
-
178
-
179
-
180
-
181
-
182
-
183
-
184
-
185
-
186
-
187
-
188
-
189
-
190
-
191
-
192
-
193
-
194
-
195
-
196
-
197
-
198
-
199
-
200
-
201
-
202
-
203
-
204
-
205
-
206
-
207
-
208
-
209
-
210
-
211
-
212
-
213
-
214
-
215
-
216
-
217
-
218
-
219
-
220
-
221
-
222
-
223
-
224
-
225
-
226
-
227
-
228
-
229
-
230
-
231
-
232
-
233
-
234
-
235
-
236
-
237
-
238
-
239
-
240
-
241
-
242
-
243
-
244
-
245
-
246
-
247
-
248
-
249
-
250
 |
 |

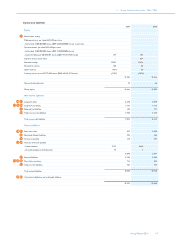
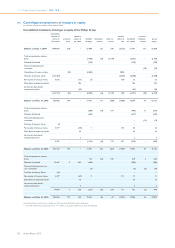
13 Group financial statements 13.6 - 13.6
Annual Report 2010 147
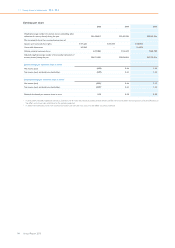
Equity and liabilities
2009 2010
Equity
Shareholders’ equity:
17
Preference shares, par value EUR 0.20 per share:
- Authorized: 2,000,000,000 shares (2009: 2,000,000,000 shares), issued none
Common shares, par value EUR 0.20 per share:
- Authorized: 2,000,000,000 shares (2009: 2,000,000,000 shares)
- Issued and fully paid: 986,078,784 shares (2009: 972,411,769 shares) 194 197
Capital in excess of par value − 354
Retained earnings 15,947 15,416
Revaluation reserve 102 86
Other reserves (461) 69
Treasury shares, at cost 39,572,400 shares (2009: 44,954,677 shares) (1,187) (1,076)
14,595 15,046
Non-controlling interests 49 46
Group equity 14,644 15,092
Non-current liabilities
Long-term debt
18 23 3,640 2,818
Long-term provisions
19 24 28 1,734 1,716
Deferred tax liabilities
3 530 171
Other non-current liabilities
20 1,929 1,714
Total non-current liabilities 7,833 6,419
Current liabilities
Short-term debt
18 23 627 1,840
Derivative financial liabilities
32 276 564
Income tax payable
3 118 291
Accounts and notes payable:
23 30
- Trade creditors 2,775 3,686
- Accounts payable to related parties 95 5
2,870 3,691
Accrued liabilities
21 2,740 2,995
Short-term provisions
19 24 28 716 623
Other current liabilities
22 703 754
Total current liabilities 8,050 10,758
Contractual obligations and contingent liabilities
23 24
30,527 32,269