Philips 2010 Annual Report Download - page 235
Download and view the complete annual report
Please find page 235 of the 2010 Philips annual report below. You can navigate through the pages in the report by either clicking on the pages listed below, or by using the keyword search tool below to find specific information within the annual report.-
 1
1 -
2
-
3
-
4
-
5
-
6
-
7
-
8
-
9
-
10
-
11
-
12
-
13
-
14
-
15
-
16
-
17
-
18
-
19
-
20
-
21
-
22
-
23
-
24
-
25
-
26
-
27
-
28
-
29
-
30
-
31
-
32
-
33
-
34
-
35
-
36
-
37
-
38
-
39
-
40
-
41
-
42
-
43
-
44
-
45
-
46
-
47
-
48
-
49
-
50
-
51
-
52
-
53
-
54
-
55
-
56
-
57
-
58
-
59
-
60
-
61
-
62
-
63
-
64
-
65
-
66
-
67
-
68
-
69
-
70
-
71
-
72
-
73
-
74
-
75
-
76
-
77
-
78
-
79
-
80
-
81
-
82
-
83
-
84
-
85
-
86
-
87
-
88
-
89
-
90
-
91
-
92
-
93
-
94
-
95
-
96
-
97
-
98
-
99
-
100
-
101
-
102
-
103
-
104
-
105
-
106
-
107
-
108
-
109
-
110
-
111
-
112
-
113
-
114
-
115
-
116
-
117
-
118
-
119
-
120
-
121
-
122
-
123
-
124
-
125
-
126
-
127
-
128
-
129
-
130
-
131
-
132
-
133
-
134
-
135
-
136
-
137
-
138
-
139
-
140
-
141
-
142
-
143
-
144
-
145
-
146
-
147
-
148
-
149
-
150
-
151
-
152
-
153
-
154
-
155
-
156
-
157
-
158
-
159
-
160
-
161
-
162
-
163
-
164
-
165
-
166
-
167
-
168
-
169
-
170
-
171
-
172
-
173
-
174
-
175
-
176
-
177
-
178
-
179
-
180
-
181
-
182
-
183
-
184
-
185
-
186
-
187
-
188
-
189
-
190
-
191
-
192
-
193
-
194
-
195
-
196
-
197
-
198
-
199
-
200
-
201
-
202
-
203
-
204
-
205
-
206
-
207
-
208
-
209
-
210
-
211
-
212
-
213
-
214
-
215
-
216
-
217
-
218
-
219
-
220
-
221
-
222
-
223
-
224
-
 225
225 -
 226
226 -
 227
227 -
 228
228 -
 229
229 -
 230
230 -
 231
231 -
 232
232 -
 233
233 -
 234
234 -
 235
235 -
 236
236 -
 237
237 -
 238
238 -
 239
239 -
 240
240 -
 241
241 -
 242
242 -
 243
243 -
 244
244 -
 245
245 -
246
-
247
-
248
-
249
-
250
 |
 |

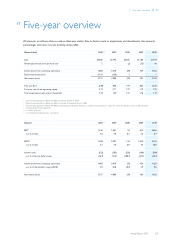
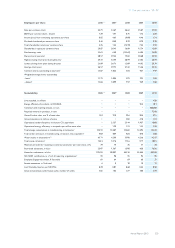
17 Five-year overview 17 - 17
Annual Report 2010 235
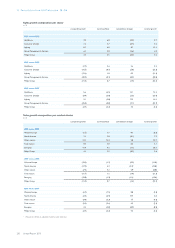
Key figures per share 20061,2,3) 20073) 2008 2009 2010
Sales per common share 22.71 24.67 26.62 25.07 27.04
EBITA per common share - diluted 1.29 1.91 0.75 1.13 2.69
Income (loss) from continuing operations per share 0.85 4.61 (0.09) 0.46 1.54
Dividend distributed per common share 0.44 0.60 0.70 0.70 0.70
Total shareholder return per common share 2.76 1.55 (14.99) 7.55 2.94
Shareholders’ equity per common share 20.87 20.41 16.84 15.74 15.89
Price/earnings ratio 33.61 6.40 (153.67) 44.96 14.88
Share price at year-end 28.57 29.52 13.83 20.68 22.92
Highest closing share price during the year 29.31 32.99 28.94 21.03 26.94
Lowest closing share price during the year 21.89 26.71 12.09 10.95 20.34
Average share price 26.57 29.73 21.42 15.26 23.35
Common shares outstanding at year-end5) 1,107 1,065 923 927 947
Weighted average shares outstanding:
- basic5) 1,175 1,086 991 925 940
- diluted5) 1,184 1,099 997 929 948
Sustainability 20061,2,3) 20073) 2008 2009 2010
Lives touched, in millions − − − − 420
Energy efficiency of products, in kWh/EUR − − − 10.5 10.1
Collection and recycling amount, in tons − − − − 100,000
Recycled material in products, in tons − − − − 7,500
Green Product sales, as a % of total sales 15.0 19.8 22.6 30.6 37.5
Green Innovation, in millions of euros − − 282 410 451
Operational carbon footprint, in kilotons CO2-equivalent − 2,157 2,144 1,937 1,808
Operational energy efficiency, in terajoules per million euro sales − 1.29 1.31 1.35 1.26
Total energy consumption in manufacturing, in terajoules6) 15,213 15,207 14,602 14,294 14,232
Total carbon emissions in manufacturing, in kilotons CO2-equivalent6) 869 864 823 816 668
Water intake, in thousands m3 6) 4,171 4,209 3,996 4,216 4,217
Total waste, in kilotons6) 125.4 127.6 113.6 97.7 104.5
Materials provided for recycling via external contractor per total waste, in % 79 79 76 77 78
Restricted substances, in kilos 2,097 1,367 1,098 638 1,036
Hazardous substances, in kilos 119,455 90,807 46,316 33,644 68,100
ISO 14001 certification, as a % of all reporting organizations6) 92 90 95 92 95
Employee Engagement Index, % favorable 61 64 69 68 75
Female executives, in % of total 6 8 10 10 11
Lost Workday Injuries, per 100 FTEs 0.78 0.81 0.68 0.44 0.50
Initial and continual conformance audits, number of audits 365 166 277 360 273