Philips 2010 Annual Report Download - page 66
Download and view the complete annual report
Please find page 66 of the 2010 Philips annual report below. You can navigate through the pages in the report by either clicking on the pages listed below, or by using the keyword search tool below to find specific information within the annual report.-
 1
1 -
2
-
3
-
4
-
5
-
6
-
7
-
8
-
9
-
10
-
11
-
12
-
13
-
14
-
15
-
16
-
17
-
18
-
19
-
20
-
21
-
22
-
23
-
24
-
25
-
26
-
27
-
28
-
29
-
30
-
31
-
32
-
33
-
34
-
35
-
36
-
37
-
38
-
39
-
40
-
41
-
42
-
43
-
44
-
45
-
46
-
47
-
48
-
49
-
50
-
51
-
52
-
53
-
54
-
55
-
 56
56 -
 57
57 -
 58
58 -
 59
59 -
 60
60 -
 61
61 -
 62
62 -
 63
63 -
 64
64 -
 65
65 -
 66
66 -
 67
67 -
 68
68 -
 69
69 -
 70
70 -
 71
71 -
 72
72 -
 73
73 -
 74
74 -
 75
75 -
 76
76 -
77
-
78
-
79
-
80
-
81
-
82
-
83
-
84
-
85
-
86
-
87
-
88
-
89
-
90
-
91
-
92
-
93
-
94
-
95
-
96
-
97
-
98
-
99
-
100
-
101
-
102
-
103
-
104
-
105
-
106
-
107
-
108
-
109
-
110
-
111
-
112
-
113
-
114
-
115
-
116
-
117
-
118
-
119
-
120
-
121
-
122
-
123
-
124
-
125
-
126
-
127
-
128
-
129
-
130
-
131
-
132
-
133
-
134
-
135
-
136
-
137
-
138
-
139
-
140
-
141
-
142
-
143
-
144
-
145
-
146
-
147
-
148
-
149
-
150
-
151
-
152
-
153
-
154
-
155
-
156
-
157
-
158
-
159
-
160
-
161
-
162
-
163
-
164
-
165
-
166
-
167
-
168
-
169
-
170
-
171
-
172
-
173
-
174
-
175
-
176
-
177
-
178
-
179
-
180
-
181
-
182
-
183
-
184
-
185
-
186
-
187
-
188
-
189
-
190
-
191
-
192
-
193
-
194
-
195
-
196
-
197
-
198
-
199
-
200
-
201
-
202
-
203
-
204
-
205
-
206
-
207
-
208
-
209
-
210
-
211
-
212
-
213
-
214
-
215
-
216
-
217
-
218
-
219
-
220
-
221
-
222
-
223
-
224
-
225
-
226
-
227
-
228
-
229
-
230
-
231
-
232
-
233
-
234
-
235
-
236
-
237
-
238
-
239
-
240
-
241
-
242
-
243
-
244
-
245
-
246
-
247
-
248
-
249
-
250
 |
 |

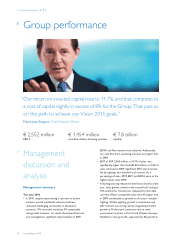
5 Group performance 5.2 - 5.2.1
66 Annual Report 2010
5.2 Liquidity and
capital resources
Philips’ diverse liquidity sources and strong management
ensure maximum flexibility in meeting changing business
needs.
5.2.1 Cash flows provided by continuing
operations
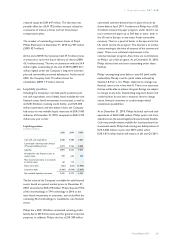
Cash flows from operating activities
Net cash flow from operating activities amounted to EUR
2,156 million in 2010, compared to EUR 1,545 million in
2009. The year-on-year improvement was largely
attributable to higher earnings across all sectors and last
year’s EUR 485 million final asbestos settlement payment,
partly offset by higher working capital requirements.
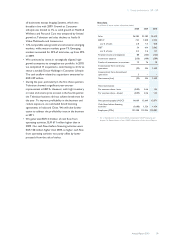
Condensed consolidated statements of cash flows for the
years ended December 31, 2008, 2009 and 2010 are
presented below:
Condensed consolidated cash flow statements1)
in millions of euros
2008 2009 2010
Cash flows from operating activities:
Net income (loss) (92) 424 1,452
Adjustments to reconcile net income
to net cash provided by operating
activities 1,740 1,121 704
Net cash provided by operating
activities 1,648 1,545 2,156
Net cash (used for) provided by
investing activities (3,254) (219) (702)
Cash flows before financing
activities2) (1,606) 1,326 1,454
Net cash used for financing activities (3,575) (545) (96)
Cash (used for) provided by
continuing operations (5,181) 781 1,358
Net cash (used for) discontinued
operations (37) − −
Effect of changes in exchange rates on
cash and cash equivalents (39) (15) 89
Total change in cash and cash
equivalents (5,257) 766 1,447
Cash and cash equivalents at the
beginning of year 8,877 3,620 4,386
Cash and cash equivalents at the end
of year - continuing operations 3,620 4,386 5,833
1) Please refer to section 13.7, Consolidated statements of cash flows, of this
Annual Report
2) Please refer to chapter 16, Reconciliation of non-GAAP information, of this
Annual Report
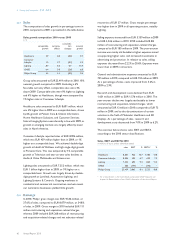
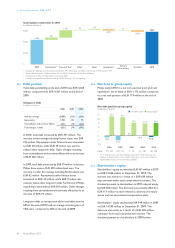
Cash flows from operating activities
and net capital expenditures
in millions of euros
■-cash flows from operating activities--■-net capital expenditures
2,500
2,000
1,500
1,000
500
0
(500)
(1,000)
(1,500)
639
(987)
2006
1,752
(928)
2007
1,648
(875)
2008
1,545
(682)
2009
2,156
(823)
2010
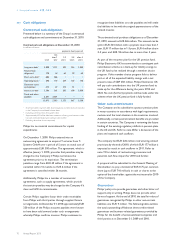
Cash flows from investing activities
Cash flows from investing activities resulted in a net
outflow of EUR 702 million, attributable to EUR 823
million cash used for net capital expenditures and EUR
239 million used for acquisitions, chiefly for Discus
Holdings, NCW Holdings LTD and medSage. This was
partly offset by EUR 385 million proceeds from
divestment, including the sale of 9.4% of the shares in TPV
and the redemption of the TPV and CBAY convertible
bonds.
2009 cash flows from investing activities resulted in a net
outflow of EUR 219 million, due to EUR 682 million cash
used for net capital expenditures, EUR 300 million used
for acquisitions, and EUR 39 million outflow related to
derivatives and securities, partly offset by EUR 802 million
inflows received mostly from the sale of other non-
current financial assets (mainly LG Display and Pace Micro
Technology).
Net capital expenditures
Net capital expenditures totaled EUR 823 million, which
was EUR 141 million higher than 2009. Higher
investments were visible in all sectors, notably additional
growth-focused investments in Lighting.
Cash flows from acquisitions,
divestments and derivatives
in millions of euros
■-divestments and derivatives--■-acquisitions
7,000
3,500
0
(3,500)
(7,000)
384
(2,498)
(2,114)
2006
6,130
(1,502)
4,628
2007
2,937
(5,316)
(2,379)
2008
763
(300)
463
2009
360
(239)
121
2010