Philips 2010 Annual Report Download - page 215
Download and view the complete annual report
Please find page 215 of the 2010 Philips annual report below. You can navigate through the pages in the report by either clicking on the pages listed below, or by using the keyword search tool below to find specific information within the annual report.-
 1
1 -
2
-
3
-
4
-
5
-
6
-
7
-
8
-
9
-
10
-
11
-
12
-
13
-
14
-
15
-
16
-
17
-
18
-
19
-
20
-
21
-
22
-
23
-
24
-
25
-
26
-
27
-
28
-
29
-
30
-
31
-
32
-
33
-
34
-
35
-
36
-
37
-
38
-
39
-
40
-
41
-
42
-
43
-
44
-
45
-
46
-
47
-
48
-
49
-
50
-
51
-
52
-
53
-
54
-
55
-
56
-
57
-
58
-
59
-
60
-
61
-
62
-
63
-
64
-
65
-
66
-
67
-
68
-
69
-
70
-
71
-
72
-
73
-
74
-
75
-
76
-
77
-
78
-
79
-
80
-
81
-
82
-
83
-
84
-
85
-
86
-
87
-
88
-
89
-
90
-
91
-
92
-
93
-
94
-
95
-
96
-
97
-
98
-
99
-
100
-
101
-
102
-
103
-
104
-
105
-
106
-
107
-
108
-
109
-
110
-
111
-
112
-
113
-
114
-
115
-
116
-
117
-
118
-
119
-
120
-
121
-
122
-
123
-
124
-
125
-
126
-
127
-
128
-
129
-
130
-
131
-
132
-
133
-
134
-
135
-
136
-
137
-
138
-
139
-
140
-
141
-
142
-
143
-
144
-
145
-
146
-
147
-
148
-
149
-
150
-
151
-
152
-
153
-
154
-
155
-
156
-
157
-
158
-
159
-
160
-
161
-
162
-
163
-
164
-
165
-
166
-
167
-
168
-
169
-
170
-
171
-
172
-
173
-
174
-
175
-
176
-
177
-
178
-
179
-
180
-
181
-
182
-
183
-
184
-
185
-
186
-
187
-
188
-
189
-
190
-
191
-
192
-
193
-
194
-
195
-
196
-
197
-
198
-
199
-
200
-
201
-
202
-
203
-
204
-
 205
205 -
 206
206 -
 207
207 -
 208
208 -
 209
209 -
 210
210 -
 211
211 -
 212
212 -
 213
213 -
 214
214 -
 215
215 -
 216
216 -
 217
217 -
 218
218 -
 219
219 -
 220
220 -
 221
221 -
 222
222 -
 223
223 -
 224
224 -
 225
225 -
226
-
227
-
228
-
229
-
230
-
231
-
232
-
233
-
234
-
235
-
236
-
237
-
238
-
239
-
240
-
241
-
242
-
243
-
244
-
245
-
246
-
247
-
248
-
249
-
250
 |
 |
15 Sustainability statements 15.4 - 15.5
Annual Report 2010 215
A fine of EUR 400 was reported in our EcoVision system in connection
with one of the incidents.
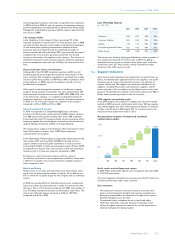
15.5 Social indicators
Engagement
In September Philips employees took part in the Engagement Survey,
giving their answers to 43 questions on leadership, management
capabilities, alignment with the company’s vision, identification with the
brand, communication, reward and recognition, diversity and inclusion,
and sustainability. The participation rate decreased to 86% compared to
91% in 2009.
Engagement Index
The Employee Engagement Index (EEI) is the single measure of the
overall level of employee engagement at Philips. It is a combination of
perceptions and attitudes related to employee satisfaction,
commitment and advocacy.
Employee Engagement Index
2007 2008 2009 2010
% favorable 64 69 68 75
% neutral 20 17 18 13
% unfavorable 16 14 14 12
The EEI improved seven points to 75% in 2010 compared with 2009,
five points ahead of our target of 70% for 2010 and exceeding the
external high performance norm. The target for 2011 is 75% favorable
(High-Performance norm).
In the coming years, we will continue to review and update our targets
by using the High-Performance norm – the score achieved by the top
20% of companies from Kenexa’s (our engagement survey partner)
database.
People Leadership Index
Since managers contribute significantly to the engagement of their
employees, we have developed the People Leadership Index (PLI),
which focuses on overall people leadership effectiveness. Our PLI –
measuring 10 aspects relating to management capabilities – increased by
3% overall, reaching 76% this year. These positive results reflect
employees’ confidence in the availability of their leaders and underline
the fact that Philips’ managers are encouraging engagement. It also
shows that our efforts to improve our managers’ leadership skills are
yielding results.
A look at the results
Over the years we have created a solid platform for engagement by
improving our leaders’ people management capabilities. Analyzing a
number of high performing units, we learned that significant
improvements are possible and how this can be achieved. The biggest
advancements in our EES scores were seen where teams worked on
areas identified last year as needing improvement. Putting the EES
results into action is therefore very important. Employees were given
the opportunity to participate in “deep dives”, in which they analyzed
their team’s EES performance and prepared concrete action plans for
improvement.
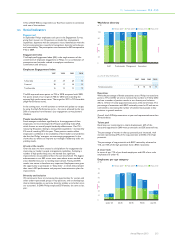
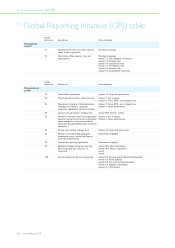
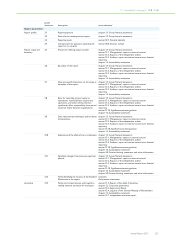
Diversity and inclusion
We continue to focus on increasing the opportunities for women and
other under-represented groups in key positions, and on developing a
diverse talent pipeline, as we know diversity enables us to better serve
our customers. In 2010, Philips employed 35% females, the same as last
year.
(150)
57
43
57
43
73
27
72
28
84
16
84
16
90
10
89
11
0
60
80
100
40
20
Staff Management ExecutivesProfessionals
Workforce diversity
in %
Male 2010Female 2009 Male 2009 Female 2010
as a % of total executives
2007 2008 2009 2010
Female executives 8 10 10 11
Executives
While the percentage of female executives across Philips increased one
point to 11% in 2010, we aim to increase that number to 15% by 2012
and see a number of positive results in our diversity and inclusion
efforts. Of the 51 newly appointed executives, 25% were female. The
percentage of executives with BRIC nationality stood at 5% and we are
committed to increasing the number of talented local people in key
positions in growth markets.
Overall, the 549 Philips executives at year-end represented more than
30 nationalities.
Talent pool
Illustrating our commitment to talent development, 65% of the
executives appointed in 2010 were promotions and 35% external hires.
The percentage of women in the top potential pool increased, with
women representing 24% of the top potentials and 30% of the high
potentials.
The percentage of top potentials with BRIC nationality advanced to
11%, and 15% of the high potentials have a BRIC nationality.
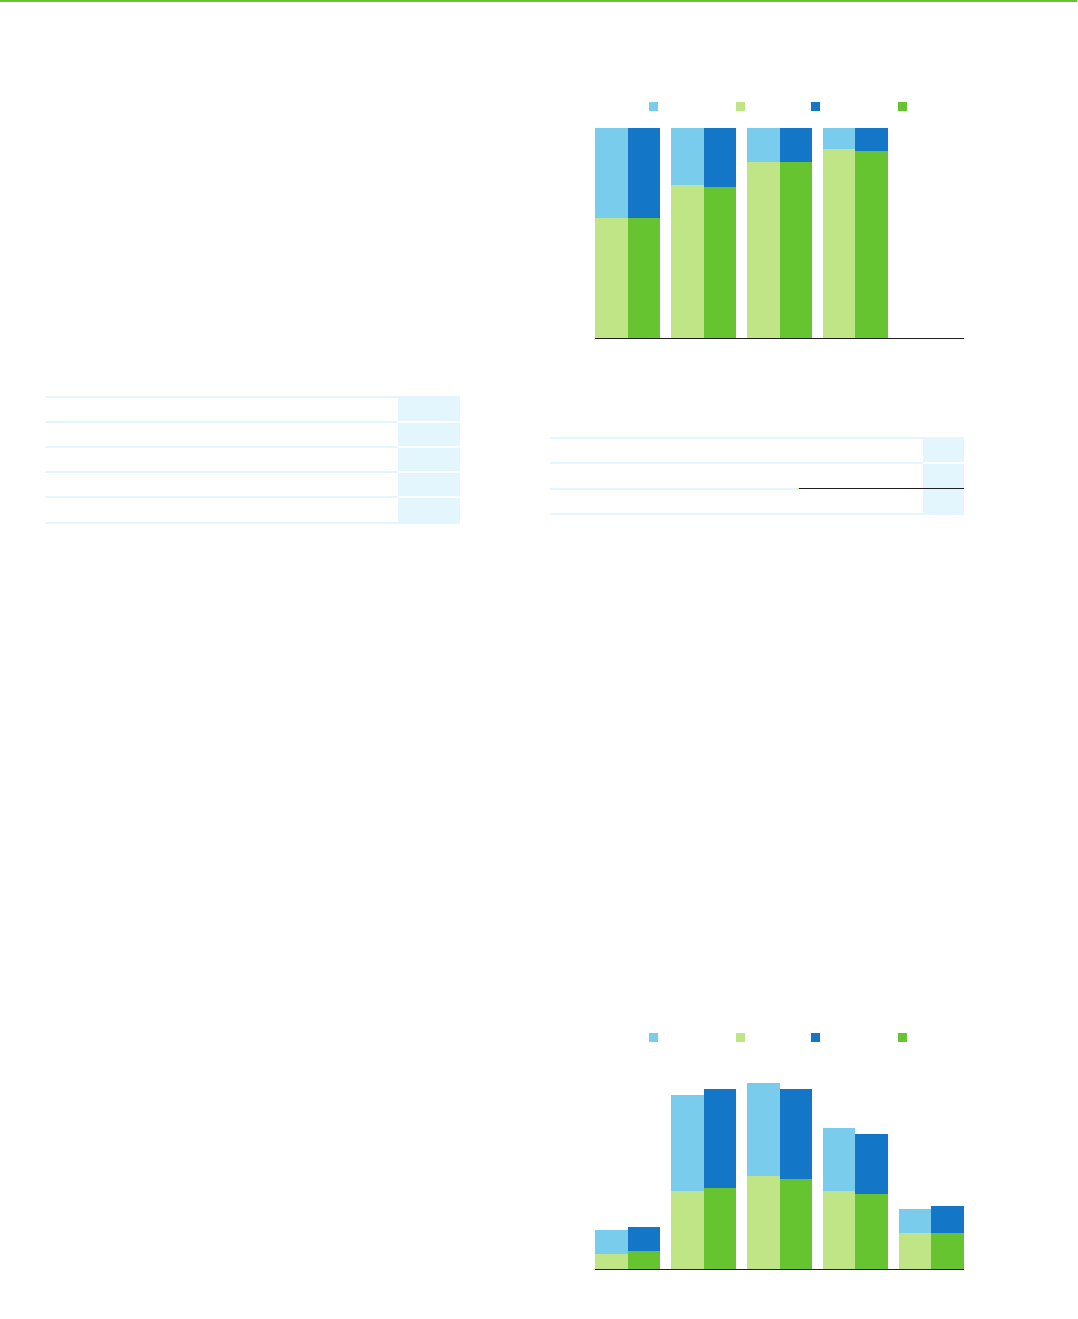
A closer look
In terms of age, 71% of our female employees and 63% of our male
employees are under 45.
(150)
5
8
6
8
26
32
27
33
31
31
30
30
26
21
25
20
12
8
12
9
0
50
60
70
40
30
20
10
under 25 35-45 45-55 over 5525-35
Employees per age category
in %
Male 2010Female 2009 Male 2009 Female 2010