Philips 2010 Annual Report Download - page 72
Download and view the complete annual report
Please find page 72 of the 2010 Philips annual report below. You can navigate through the pages in the report by either clicking on the pages listed below, or by using the keyword search tool below to find specific information within the annual report.-
 1
1 -
2
-
3
-
4
-
5
-
6
-
7
-
8
-
9
-
10
-
11
-
12
-
13
-
14
-
15
-
16
-
17
-
18
-
19
-
20
-
21
-
22
-
23
-
24
-
25
-
26
-
27
-
28
-
29
-
30
-
31
-
32
-
33
-
34
-
35
-
36
-
37
-
38
-
39
-
40
-
41
-
42
-
43
-
44
-
45
-
46
-
47
-
48
-
49
-
50
-
51
-
52
-
53
-
54
-
55
-
56
-
57
-
58
-
59
-
60
-
61
-
 62
62 -
 63
63 -
 64
64 -
 65
65 -
 66
66 -
 67
67 -
 68
68 -
 69
69 -
 70
70 -
 71
71 -
 72
72 -
 73
73 -
 74
74 -
 75
75 -
 76
76 -
 77
77 -
 78
78 -
 79
79 -
 80
80 -
 81
81 -
 82
82 -
83
-
84
-
85
-
86
-
87
-
88
-
89
-
90
-
91
-
92
-
93
-
94
-
95
-
96
-
97
-
98
-
99
-
100
-
101
-
102
-
103
-
104
-
105
-
106
-
107
-
108
-
109
-
110
-
111
-
112
-
113
-
114
-
115
-
116
-
117
-
118
-
119
-
120
-
121
-
122
-
123
-
124
-
125
-
126
-
127
-
128
-
129
-
130
-
131
-
132
-
133
-
134
-
135
-
136
-
137
-
138
-
139
-
140
-
141
-
142
-
143
-
144
-
145
-
146
-
147
-
148
-
149
-
150
-
151
-
152
-
153
-
154
-
155
-
156
-
157
-
158
-
159
-
160
-
161
-
162
-
163
-
164
-
165
-
166
-
167
-
168
-
169
-
170
-
171
-
172
-
173
-
174
-
175
-
176
-
177
-
178
-
179
-
180
-
181
-
182
-
183
-
184
-
185
-
186
-
187
-
188
-
189
-
190
-
191
-
192
-
193
-
194
-
195
-
196
-
197
-
198
-
199
-
200
-
201
-
202
-
203
-
204
-
205
-
206
-
207
-
208
-
209
-
210
-
211
-
212
-
213
-
214
-
215
-
216
-
217
-
218
-
219
-
220
-
221
-
222
-
223
-
224
-
225
-
226
-
227
-
228
-
229
-
230
-
231
-
232
-
233
-
234
-
235
-
236
-
237
-
238
-
239
-
240
-
241
-
242
-
243
-
244
-
245
-
246
-
247
-
248
-
249
-
250
 |
 |

5 Group performance 5.3.1 - 5.3.2
72 Annual Report 2010
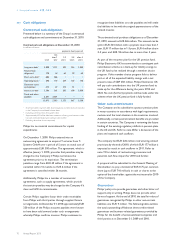
regions. Overall, the result is stable, and 59% of our
businesses currently hold industry leadership positions
(60% in 2009). In line with our growth targets in Vision
2015, in 2011 we will continue to drive for further
leadership in NPS in key markets. The implementation of
this measure has confirmed that outstanding customer
and consumer loyalty is critical to achieving growth.
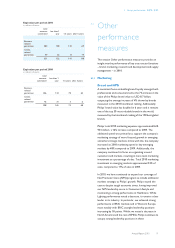
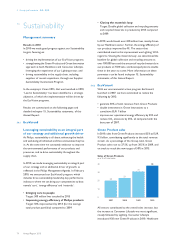
Online
Philips continued to build brand loyalty and promoters via
its online marketing strategies in 2010. Within the Lighting
sector, the company launched a new social media-enabled
platform designed to showcase the company’s leadership
in the lighting industry and more importantly, drive
meaningful dialog among existing and prospective
customers and stakeholders.
Additionally, in 2010, the company developed several
online communities, which, supported by social media
capabilities, enabled the company to facilitate dialog and
networking with its professional audiences in both
Lighting and Healthcare. Going forward, the company will
continue to drive its online marketing efforts with the use
of new enabling technologies and communication
platforms and leveraging the platform as a sales enabler. In
2010, Philips’ online sales reached EUR 570 million, a 41%
increase from 2009 where online sales reached EUR 405
million. Online sales in from emerging markets
represented approximately 30% of total online sales in
2010 and grew by 94% over the prior year.
In further support of sustainability and corporate
responsibility, the company continued its efforts with
asimpleswitch.com, its online platform that promotes
smart energy efficiency and consumption. Since its launch
in 2009, the site has gained in momentum and popularity,
building an online supporter base of over 100,000
individuals by year-end.
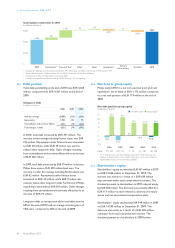
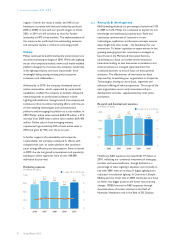
Marketing expenses
in millions of euros ■-in value----as a % of sales
1,200
900
600
300
0
12
9
6
3
0
3.2
865
2006
3.7
994
2007
3.6
949
2008
3.5
804
2009
3.7
934
2010
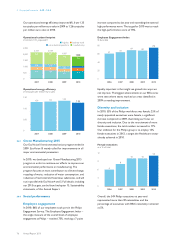
5.3.2 Research & development
R&D spending declined as a percentage of sales from 7.0%
in 2009 to 6.2%. Philips has continued to expand its vast
knowledge and intellectual property base. Early and
continuous involvement of customers in new
technologies, application and business concepts ensures
deep insight into their needs – the foundation for our
innovations. To better capitalize on opportunities in fast-
growing emerging markets, innovation is managed at
board level in the Markets & Innovation function,
underlining our focus on market-driven innovation.
Innovation leading to new businesses in incubators and
internal ventures is managed separately from the
traditional business to ensure focus on these growth
initiatives. The effectiveness of innovation has been
improved by streamlining our organization in Corporate
Technologies, leading to more focus, alignment and
enhanced offering of value propositions. The scope of the
new organization covers early innovation and pre-
development activities, supplemented by small series
production.
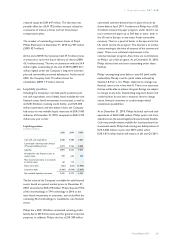
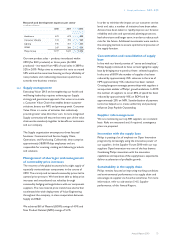
Research and development expenses
in millions of euros ■-in value----as a % of sales
2,000
1,500
1,000
500
0
20
15
10
5
0
5.8
1,556
2006
6.0
1,601
2007
6.7
1,777
2008
7.0
1,631
2009
6.2
1,576
2010
Healthcare R&D expenses increased EUR 19 million in
2010, reflecting our continued investment in emerging
markets and home healthcare, though declined as a
percentage of sales. Lighting’s expenses were broadly in
line with 2009, with an increase in digital lighting and a
reduction in traditional lighting. In Consumer Lifestyle,
R&D spend was lower than in 2009, mainly due to a focus
on fewer, but bigger projects and lower restructuring
charges. GM&S lowered its R&D expenses through
discontinuation of certain activities in the field of
Molecular Healthcare and in the field of 3D Displays.