Philips 2010 Annual Report Download - page 69
Download and view the complete annual report
Please find page 69 of the 2010 Philips annual report below. You can navigate through the pages in the report by either clicking on the pages listed below, or by using the keyword search tool below to find specific information within the annual report.-
 1
1 -
2
-
3
-
4
-
5
-
6
-
7
-
8
-
9
-
10
-
11
-
12
-
13
-
14
-
15
-
16
-
17
-
18
-
19
-
20
-
21
-
22
-
23
-
24
-
25
-
26
-
27
-
28
-
29
-
30
-
31
-
32
-
33
-
34
-
35
-
36
-
37
-
38
-
39
-
40
-
41
-
42
-
43
-
44
-
45
-
46
-
47
-
48
-
49
-
50
-
51
-
52
-
53
-
54
-
55
-
56
-
57
-
58
-
 59
59 -
 60
60 -
 61
61 -
 62
62 -
 63
63 -
 64
64 -
 65
65 -
 66
66 -
 67
67 -
 68
68 -
 69
69 -
 70
70 -
 71
71 -
 72
72 -
 73
73 -
 74
74 -
 75
75 -
 76
76 -
 77
77 -
 78
78 -
 79
79 -
80
-
81
-
82
-
83
-
84
-
85
-
86
-
87
-
88
-
89
-
90
-
91
-
92
-
93
-
94
-
95
-
96
-
97
-
98
-
99
-
100
-
101
-
102
-
103
-
104
-
105
-
106
-
107
-
108
-
109
-
110
-
111
-
112
-
113
-
114
-
115
-
116
-
117
-
118
-
119
-
120
-
121
-
122
-
123
-
124
-
125
-
126
-
127
-
128
-
129
-
130
-
131
-
132
-
133
-
134
-
135
-
136
-
137
-
138
-
139
-
140
-
141
-
142
-
143
-
144
-
145
-
146
-
147
-
148
-
149
-
150
-
151
-
152
-
153
-
154
-
155
-
156
-
157
-
158
-
159
-
160
-
161
-
162
-
163
-
164
-
165
-
166
-
167
-
168
-
169
-
170
-
171
-
172
-
173
-
174
-
175
-
176
-
177
-
178
-
179
-
180
-
181
-
182
-
183
-
184
-
185
-
186
-
187
-
188
-
189
-
190
-
191
-
192
-
193
-
194
-
195
-
196
-
197
-
198
-
199
-
200
-
201
-
202
-
203
-
204
-
205
-
206
-
207
-
208
-
209
-
210
-
211
-
212
-
213
-
214
-
215
-
216
-
217
-
218
-
219
-
220
-
221
-
222
-
223
-
224
-
225
-
226
-
227
-
228
-
229
-
230
-
231
-
232
-
233
-
234
-
235
-
236
-
237
-
238
-
239
-
240
-
241
-
242
-
243
-
244
-
245
-
246
-
247
-
248
-
249
-
250
 |
 |

5 Group performance 5.2.7 - 5.2.8
Annual Report 2010 69
reduced equity by EUR 647 million. The decrease was
partially offset by a EUR 102 million increase related to
re-issuance of treasury shares and net share-based
compensation plans.
The number of outstanding common shares of Royal
Philips Electronics at December 31, 2010 was 947 million
(2009: 927 million).
At the end of 2010, the Company held 37.7 million shares
in treasury to cover the future delivery of shares (2009:
43.1 million shares). This was in connection with the 54.9
million rights outstanding at the end of 2010 (2009: 62.1
million rights) under the Company’s long-term incentive
plan and convertible personnel debentures. At the end of
2010, the Company held 1.9 million shares for
cancellation (2009: 1.9 million shares).
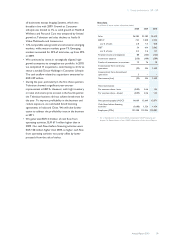
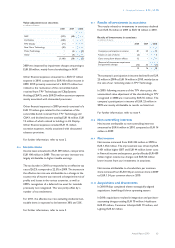
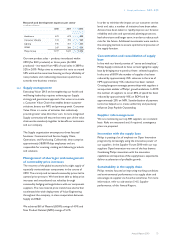
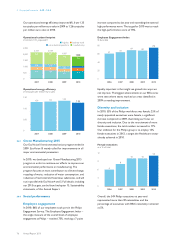
5.2.8 Liquidity position
Including the Company’s net debt (cash) position (cash
and cash equivalents, net of debt), listed available-for-sale
financial assets, listed investments in associates, as well as
its EUR1.8 billion revolving credit facility, and EUR 200
million committed undrawn bilateral loan, the Company
had access to net available liquid resources of EUR 3,445
million as of December 31, 2010, compared to EUR 2,412
million one year earlier.
Liquidity position
in millions of euros
2008 2009 2010
Cash and cash equivalents 3,620 4,386 5,833
Committed revolving credit facility/
CP program/Bilateral loan 2,274 1,936 2,000
Liquidity 5,894 6,322 7,833
Available-for-sale financial assets at
market value 599 244 270
Main listed investments in associates
at market value 60 113 −
Short-term debt (722) (627) (1,840)
Long-term debt (3,466) (3,640) (2,818)
Net available liquidity resources 2,365 2,412 3,445
The fair value of the Company’s available-for-sale financial
assets, based on quoted market prices at December 31,
2010, amounted to EUR 270 million. Philips disposed 9.4%
of the shareholdings in TPV technology in 2010 as the
main listed investments in associates, and reclassified the
remaining 3% shareholdings to available-for-sale financial
assets.
Philips has a EUR 1.8 billion committed revolving credit
facility due in 2015 that can be used for general corporate
purposes. In addition, Philips also has a EUR 200 million
committed undrawn bilateral loan in place that can be
drawn before April 2011. Furthermore Philips has a USD
2.5 billion commercial paper program, under which it can
issue commercial paper up to 364 days in tenor, both in
the US and in Europe, in any major freely convertible
currency. There is a panel of banks, in Europe and in the
US, which service the program. The interest is at market
rates prevailing at the time of issuance of the commercial
paper. There is no collateral requirement in the
commercial paper program. Also, there are no limitations
on Philips’ use of the program. As at December 31, 2010,
Philips did not have any loans outstanding under these
facilities.
Philips’ existing long-term debt is rated A3 (with stable
outlook) by Moody’s and A- (with stable outlook) by
Standard & Poor’s. It is Philips’ objective to manage our
financial ratios to be in line with A. There is no assurance
that we will be able to achieve this goal. Ratings are subject
to change at any time. Outstanding long-term bonds and
credit facilities do not have a material adverse change
clause, financial covenants or credit-rating-related
acceleration possibilities.
As at December 31, 2010, Philips had total cash and cash
equivalents of EUR 5,833 million. Philips pools cash from
subsidiaries to the extent legally and economically feasible.
Cash not pooled remains available for local operational or
investment needs. Philips had a total gross debt position of
EUR 4,658 million at year-end 2010 within which
EUR 1,012 million bonds will mature in Q1 and Q2 2011.