Philips 2010 Annual Report Download - page 161
Download and view the complete annual report
Please find page 161 of the 2010 Philips annual report below. You can navigate through the pages in the report by either clicking on the pages listed below, or by using the keyword search tool below to find specific information within the annual report.-
 1
1 -
2
-
3
-
4
-
5
-
6
-
7
-
8
-
9
-
10
-
11
-
12
-
13
-
14
-
15
-
16
-
17
-
18
-
19
-
20
-
21
-
22
-
23
-
24
-
25
-
26
-
27
-
28
-
29
-
30
-
31
-
32
-
33
-
34
-
35
-
36
-
37
-
38
-
39
-
40
-
41
-
42
-
43
-
44
-
45
-
46
-
47
-
48
-
49
-
50
-
51
-
52
-
53
-
54
-
55
-
56
-
57
-
58
-
59
-
60
-
61
-
62
-
63
-
64
-
65
-
66
-
67
-
68
-
69
-
70
-
71
-
72
-
73
-
74
-
75
-
76
-
77
-
78
-
79
-
80
-
81
-
82
-
83
-
84
-
85
-
86
-
87
-
88
-
89
-
90
-
91
-
92
-
93
-
94
-
95
-
96
-
97
-
98
-
99
-
100
-
101
-
102
-
103
-
104
-
105
-
106
-
107
-
108
-
109
-
110
-
111
-
112
-
113
-
114
-
115
-
116
-
117
-
118
-
119
-
120
-
121
-
122
-
123
-
124
-
125
-
126
-
127
-
128
-
129
-
130
-
131
-
132
-
133
-
134
-
135
-
136
-
137
-
138
-
139
-
140
-
141
-
142
-
143
-
144
-
145
-
146
-
147
-
148
-
149
-
150
-
 151
151 -
 152
152 -
 153
153 -
 154
154 -
 155
155 -
 156
156 -
 157
157 -
 158
158 -
 159
159 -
 160
160 -
 161
161 -
 162
162 -
 163
163 -
 164
164 -
 165
165 -
 166
166 -
 167
167 -
 168
168 -
 169
169 -
 170
170 -
 171
171 -
172
-
173
-
174
-
175
-
176
-
177
-
178
-
179
-
180
-
181
-
182
-
183
-
184
-
185
-
186
-
187
-
188
-
189
-
190
-
191
-
192
-
193
-
194
-
195
-
196
-
197
-
198
-
199
-
200
-
201
-
202
-
203
-
204
-
205
-
206
-
207
-
208
-
209
-
210
-
211
-
212
-
213
-
214
-
215
-
216
-
217
-
218
-
219
-
220
-
221
-
222
-
223
-
224
-
225
-
226
-
227
-
228
-
229
-
230
-
231
-
232
-
233
-
234
-
235
-
236
-
237
-
238
-
239
-
240
-
241
-
242
-
243
-
244
-
245
-
246
-
247
-
248
-
249
-
250
 |
 |

13 Group financial statements 13.10 - 13.11 1
Annual Report 2010 161
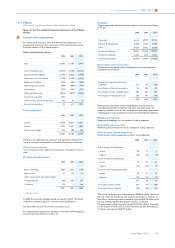
13.11 Notes
All amounts in millions of euros unless otherwise stated.
Notes to the Consolidated financial statements of the Philips
Group
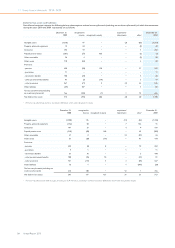
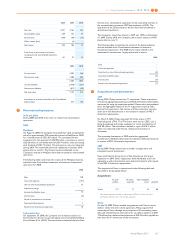
1Income from operations
For information related to Sales and Income from operations on a
geographical and sector basis, see section 13.9, Information by sector
and main country, of this Annual Report.
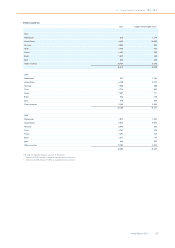
Sales and costs by nature
2008 2009 2010
Sales 26,385 23,189 25,419
Costs of materials used (12,017) (9,660) (10,114)
Employee benefit expenses (5,981) (5,825) (5,968)
Depreciation and amortization (1,528) (1,469) (1,422)
Shipping and handling (595) (505) (485)
Advertising and promotion (949) (804) (934)
Lease expense (322) (352) (301)
Other operational costs (4,813) (4,019) (4,206)
Impairment of goodwill (301) − −
Other business income and expenses 175 59 76
Income from operations 54 614 2,065
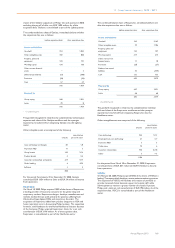
Sales composition
2008 2009 2010
Goods 23,568 20,254 22,012
Services 2,325 2,527 2,869
Licenses and royalties 492 408 538
26,385 23,189 25,419
Philips has no single external customer that represents 10 percent or
more of revenues and therefore no further information is disclosed.
Costs of materials used
Cost of materials used represent the inventory recognized in cost of
sales.
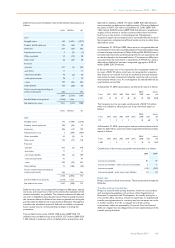
Employee benefit expenses
2008 2009 2010
Salaries and wages 5,094 5,075 5,190
Pension costs 75 110 15
Other social security and similar charges:
- Required by law 6881) 6391) 597
- Voluntary 1241) 11) 166
5,981 5,825 5,968
1) Revised allocation
In 2009, the voluntary charges include an amount of EUR 134 million
related to curtailment gains for retiree medical benefit plans.
See note 28 for further information on pension costs.
For remuneration details of the members of the Board of Management
and the Supervisory Board, see note 31.
Employees
The average number of employees by category is summarized as follows
(in FTEs):
2008 2009 2010
Production 66,675 60,179 57,756
Research & development 11,926 11,563 12,388
Other 34,365 35,922 33,588
Permanent employees 112,966 107,664 103,732
Temporary employees 13,493 9,923 13,318
Continuing operations 126,459 117,587 117,050
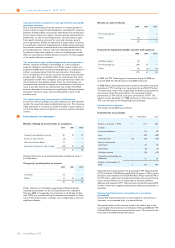
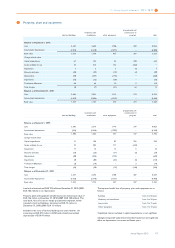
Depreciation and amortization
Depreciation of property, plant and equipment and amortization of
intangibles are as follows:
2008 2009 2010
Depreciation of property, plant and
equipment 729 746 678
Amortization of internal-use software 92 106 89
Amortization of other intangible assets 389 436 487
Amortization of development costs 318 181 168
1,528 1,469 1,422
Depreciation of property, plant and equipment and amortization
(including impairment) of software and other intangible assets are
primarily included in cost of sales. Amortization (including impairment)
of development cost is included in research and development expenses.
Shipping and handling
Shipping and handling costs are included in selling expenses.
Advertising and promotion
Advertising and promotion costs are included in selling expenses.
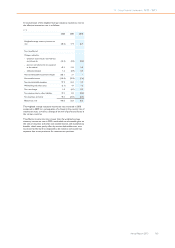
Other business income (expenses)
Other business income (expenses) consists of the following:
2008 2009 2010
Result on disposal of businesses:
- income 136 13 9
- expense (45) (13) (8)
Result on disposal of fixed assets:
- income 72 33 54
- expense (16) (13) (9)
Result on other remaining businesses:
- income 53 51 37
- expense (25) (12) (7)
175 59 76
Total other business income 261 97 100
Total other business expense (86) (38) (24)
The results on the disposal of businesses in 2008 are mainly related to
the sale of the Set-Top Boxes and Connectivity Solutions activities to
Pace Micro Technology which resulted in a gain of EUR 42 million, and
the sale of Philips Speech Recognition activities to Nuance
Communications which resulted in a gain of EUR 45 million. The result
on the disposal of fixed assets is mainly related to the sale of fixed assets
in Taiwan with a gain of EUR 39 million.