Philips 2010 Annual Report Download - page 62
Download and view the complete annual report
Please find page 62 of the 2010 Philips annual report below. You can navigate through the pages in the report by either clicking on the pages listed below, or by using the keyword search tool below to find specific information within the annual report.-
 1
1 -
2
-
3
-
4
-
5
-
6
-
7
-
8
-
9
-
10
-
11
-
12
-
13
-
14
-
15
-
16
-
17
-
18
-
19
-
20
-
21
-
22
-
23
-
24
-
25
-
26
-
27
-
28
-
29
-
30
-
31
-
32
-
33
-
34
-
35
-
36
-
37
-
38
-
39
-
40
-
41
-
42
-
43
-
44
-
45
-
46
-
47
-
48
-
49
-
50
-
51
-
 52
52 -
 53
53 -
 54
54 -
 55
55 -
 56
56 -
 57
57 -
 58
58 -
 59
59 -
 60
60 -
 61
61 -
 62
62 -
 63
63 -
 64
64 -
 65
65 -
 66
66 -
 67
67 -
 68
68 -
 69
69 -
 70
70 -
 71
71 -
 72
72 -
73
-
74
-
75
-
76
-
77
-
78
-
79
-
80
-
81
-
82
-
83
-
84
-
85
-
86
-
87
-
88
-
89
-
90
-
91
-
92
-
93
-
94
-
95
-
96
-
97
-
98
-
99
-
100
-
101
-
102
-
103
-
104
-
105
-
106
-
107
-
108
-
109
-
110
-
111
-
112
-
113
-
114
-
115
-
116
-
117
-
118
-
119
-
120
-
121
-
122
-
123
-
124
-
125
-
126
-
127
-
128
-
129
-
130
-
131
-
132
-
133
-
134
-
135
-
136
-
137
-
138
-
139
-
140
-
141
-
142
-
143
-
144
-
145
-
146
-
147
-
148
-
149
-
150
-
151
-
152
-
153
-
154
-
155
-
156
-
157
-
158
-
159
-
160
-
161
-
162
-
163
-
164
-
165
-
166
-
167
-
168
-
169
-
170
-
171
-
172
-
173
-
174
-
175
-
176
-
177
-
178
-
179
-
180
-
181
-
182
-
183
-
184
-
185
-
186
-
187
-
188
-
189
-
190
-
191
-
192
-
193
-
194
-
195
-
196
-
197
-
198
-
199
-
200
-
201
-
202
-
203
-
204
-
205
-
206
-
207
-
208
-
209
-
210
-
211
-
212
-
213
-
214
-
215
-
216
-
217
-
218
-
219
-
220
-
221
-
222
-
223
-
224
-
225
-
226
-
227
-
228
-
229
-
230
-
231
-
232
-
233
-
234
-
235
-
236
-
237
-
238
-
239
-
240
-
241
-
242
-
243
-
244
-
245
-
246
-
247
-
248
-
249
-
250
 |
 |

5 Group performance 5.1.4 - 5.1.5
62 Annual Report 2010
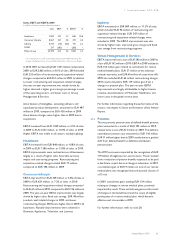
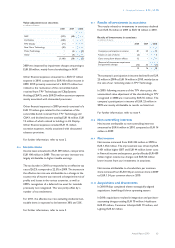
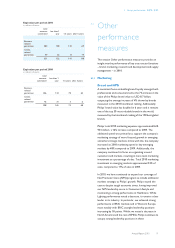
5.1.4 Restructuring and impairment charges
In 2010, EBIT included net charges totaling EUR 162
million for restructuring and related asset impairments.
2009 included EUR 450 million of restructuring and
related asset impairment charges. In addition to the annual
goodwill impairment tests for Philips, trigger-based
impairment tests were performed during the year,
resulting in no goodwill impairments.
For further information on sensitivity analysis, please refer
to note 8.
Restructuring and related charges
in millions of euros
2008 2009 2010
Restructuring charges per sector:
Healthcare 63 42 48
Consumer Lifestyle 198 120 42
Lighting 245 225 74
GM&S 35 63 (2)
541 450 162
Cost breakdown of restructuring charges:
Personnel lay-off costs 374 399 155
Release of provision (2) (81) (77)
Restructuring-related asset impairment 116 84 19
Other restructuring-related costs 53 481) 65
541 450 162
1) Includes EUR 22 million of costs which were expensed as incurred
The restructuring charges in 2010 were mainly
attributable to the operating sectors. Within Healthcare,
the largest projects related to the reorganization of the
commercial organization in Imaging Systems (Germany,
Netherlands, and the US). Consumer Lifestyle
restructuring charges were mainly in Television,
particularly in China due to the brand licensing agreement
with TPV. Restructuring projects in Lighting were focused
on reduction of production capacity in traditional lighting
technologies, such as incandescent. The largest projects
were initiated in Brazil, France, and the US.
In 2009, the most significant restructuring projects related
to Lighting and Consumer Lifestyle. Restructuring
projects at Lighting centered on Lamps. The largest
restructuring projects were in the Netherlands, Belgium,
Poland and various locations in the US. Consumer
Lifestyle restructuring projects focused on Television
(primarily Belgium and France), Accessories (mainly
Technology & Development in the Netherlands) and
Domestic Appliances (mainly Singapore and China).
Healthcare initiated various restructuring projects aimed
at reduction of the fixed cost structure, mainly impacting
Imaging Systems (Netherlands), Home Healthcare
Solutions and Patient Care & Clinical Informatics (various
locations in the US).
Other restructuring projects focused on reducing the
fixed cost structure of Corporate Technologies, Philips
Information Technology, Philips Design, and Corporate
Overheads within Group Management & Services.
For further information on restructuring, refer to note 19.
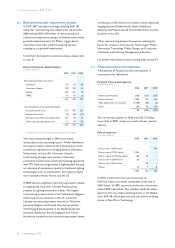
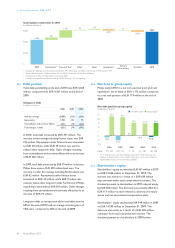
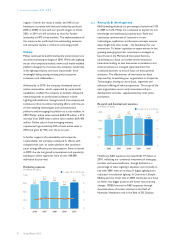
5.1.5 Financial income and expenses
A breakdown of Financial income and expenses is
presented in the table below.
Financial income and expenses
in millions of euros
2008 2009 2010
Interest expense (net) (105) (252) (225)
Sale of securities 1,406 126 162
Value adjustments on securities (1,148) (58) (2)
Other (65) 18 (57)
88 (166) (122)
The net interest expense in 2010 was EUR 27 million
lower than in 2009, mainly as a result of lower interest
expense.
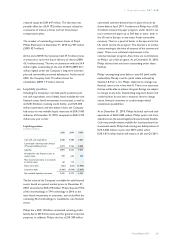
Sale of securities
in millions of euros
2008 2009 2010
Gain on sale of NXP shares − − 154
Gain on sale of TSMC shares 1,205 − −
Gain on sale of LG Display shares 158 69 −
Gain on sale of D&M shares 20 − −
Gain on sale of Pace shares − 48 −
Others 23 9 8
1,406 126 162
In 2010, income from the sale of securities of
EUR 162 million was mainly attributable to the sale of
NXP shares. In 2009, income from the sale of securities
totaled EUR 126 million. This included a EUR 69 million
gain from the sale of the remaining shares in LG Display,
and a EUR 48 million gain from the sale of the remaining
shares in Pace Micro Technology.