Philips 2010 Annual Report Download - page 189
Download and view the complete annual report
Please find page 189 of the 2010 Philips annual report below. You can navigate through the pages in the report by either clicking on the pages listed below, or by using the keyword search tool below to find specific information within the annual report.-
 1
1 -
2
-
3
-
4
-
5
-
6
-
7
-
8
-
9
-
10
-
11
-
12
-
13
-
14
-
15
-
16
-
17
-
18
-
19
-
20
-
21
-
22
-
23
-
24
-
25
-
26
-
27
-
28
-
29
-
30
-
31
-
32
-
33
-
34
-
35
-
36
-
37
-
38
-
39
-
40
-
41
-
42
-
43
-
44
-
45
-
46
-
47
-
48
-
49
-
50
-
51
-
52
-
53
-
54
-
55
-
56
-
57
-
58
-
59
-
60
-
61
-
62
-
63
-
64
-
65
-
66
-
67
-
68
-
69
-
70
-
71
-
72
-
73
-
74
-
75
-
76
-
77
-
78
-
79
-
80
-
81
-
82
-
83
-
84
-
85
-
86
-
87
-
88
-
89
-
90
-
91
-
92
-
93
-
94
-
95
-
96
-
97
-
98
-
99
-
100
-
101
-
102
-
103
-
104
-
105
-
106
-
107
-
108
-
109
-
110
-
111
-
112
-
113
-
114
-
115
-
116
-
117
-
118
-
119
-
120
-
121
-
122
-
123
-
124
-
125
-
126
-
127
-
128
-
129
-
130
-
131
-
132
-
133
-
134
-
135
-
136
-
137
-
138
-
139
-
140
-
141
-
142
-
143
-
144
-
145
-
146
-
147
-
148
-
149
-
150
-
151
-
152
-
153
-
154
-
155
-
156
-
157
-
158
-
159
-
160
-
161
-
162
-
163
-
164
-
165
-
166
-
167
-
168
-
169
-
170
-
171
-
172
-
173
-
174
-
175
-
176
-
177
-
178
-
 179
179 -
 180
180 -
 181
181 -
 182
182 -
 183
183 -
 184
184 -
 185
185 -
 186
186 -
 187
187 -
 188
188 -
 189
189 -
 190
190 -
 191
191 -
 192
192 -
 193
193 -
 194
194 -
 195
195 -
 196
196 -
 197
197 -
 198
198 -
 199
199 -
200
-
201
-
202
-
203
-
204
-
205
-
206
-
207
-
208
-
209
-
210
-
211
-
212
-
213
-
214
-
215
-
216
-
217
-
218
-
219
-
220
-
221
-
222
-
223
-
224
-
225
-
226
-
227
-
228
-
229
-
230
-
231
-
232
-
233
-
234
-
235
-
236
-
237
-
238
-
239
-
240
-
241
-
242
-
243
-
244
-
245
-
246
-
247
-
248
-
249
-
250
 |
 |

13 Group financial statements 13.11 - 13.11 30 31
Annual Report 2010 189
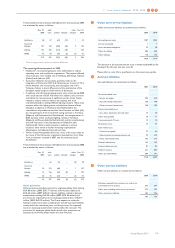
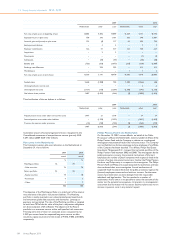
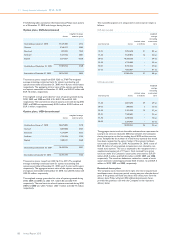
A summary of the status of the Company’s restricted share plans as of
December 31, 2010 and changes during the year are presented below:
Restricted share rights, EUR-denominated1)
shares
weighted
average grant-
date fair value
Outstanding at January 1, 2010 2,028,565 18.56
Granted 826,577 23.42
Vested/Issued 1,037,427 21.86
Forfeited 120,347 17.89
Outstanding at December 31, 2010 1,697,368 18.96
1) Excludes 20% additional (premium) shares that may be received if shares
delivered under the restricted share rights plan are not sold for a three-year
period
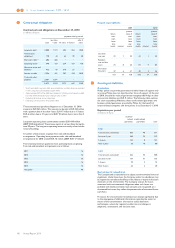
Restricted share rights, USD-denominated1)
shares
weighted
average grant-
date fair value
Outstanding at January 1, 2010 1,602,001 27.06
Granted 522,606 31.46
Vested/Issued 807,408 31.08
Forfeited 118,157 27.16
Outstanding at December 31, 2010 1,199,042 26.28
1) Excludes 20% additional (premium) shares that may be received if shares
delivered under the restricted share rights plan are not sold for a three-year
period
At December 31, 2010, a total of EUR 35 million of unrecognized
compensation cost related to non-vested restricted share rights. This
cost is expected to be recognized over a weighted-average period of 2.0
years.
Other plans
Employee share purchase plan
Under the terms of employee stock purchase plans established by the
Company in various countries, substantially all employees in those
countries are eligible to purchase a limited number of Philips shares at
discounted prices through payroll withholdings, of which the maximum
ranges from 8.5% to 10% of total salary. Generally, the discount
provided to the employees is in the range of 10% to 20%. A total of
1,411,956 shares were sold to employees in 2010 under the plan at an
average price of EUR 22.54 (2009: 2,185,647 shares at EUR 13.30, 2008:
1,051,206 shares at EUR 21.82).
Convertible personnel debentures
In the Netherlands, the Company issued personnel debentures with a
2-year right of conversion into common shares of Royal Philips
Electronics starting three years after the date of issuance, with a
conversion price equal to the share price on that date. The last issuance
of this particular plan was in December 2008. From 2009 onwards,
employees in the Netherlands are able to join an employee share
purchase plan as described in the previous paragraph. The fair value of
the conversion option of EUR 2.13 in 2008 was recorded as
compensation expense. In 2010, 279,170 shares were issued in
conjunction with conversions at an average price of EUR 20.86 (2009:
183,330 shares at an average price of EUR 19.56, 2008: 485,331 shares
at an average price of EUR 19.13).
Lumileds plan
In December 2006, the Company offered to exchange outstanding
Lumileds Depository Receipts and options for cash and shared-based
instruments settled in cash. The amount to be paid to settle the
obligation, with respect to share-based instruments, will fluctuate based
upon changes in the fair value of Lumileds. Substantially all of the holders
of the options and the depository receipts accepted the Company offer.
The amount of the share-based payment liability, which is denominated
in US dollars, recorded at December 31, 2009 was EUR 31.6 million.
During 2010, the Company paid EUR 17.6 million as a part of the
settlement of the liability. Additionally, an increase of EUR 24.1 million
was recognized to reflect an adjustment to the value of the liability. The
balance at December 31, 2010 amounted to EUR 38.1 million which will
be settled in 2011 and 2012.
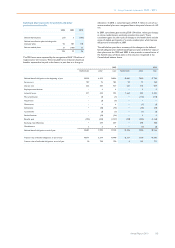
30 Related-party transactions
In the normal course of business, Philips purchases and sells goods and
services from/to various related parties in which Philips typically holds a
50% or less equity interest and has significant influence. These
transactions are generally conducted with terms comparable to
transactions with third parties.
2008 2009 2010
Sales of goods and services 174 150 169
Purchases of goods and services 692 424 229
Receivables from related parties 24 14 20
Payables to related parties 112 95 5
For remuneration details of the members of the Board of Management
and the Supervisory Board see note 31.
For employee benefit plans see note 28.
In 2010, Philips sold its entire stake in NXP to Philips Pension Trustees
Limited. For further details of this related party transaction see note 11.
31 Information on remuneration
Remuneration of the Board of Management
In 2010, the remuneration costs relating to the members of the Board
of Management amounted to EUR 9,018,514 (2009: EUR 6,526,741;
2008: EUR 7,611,602).
When pension rights are granted to members of the Board of
Management, necessary payments (if insured) and all necessary
provisions are made in accordance with the applicable accounting
principles. In 2010, no (additional) pension benefits were granted to
former members of the Board of Management.
In addition, in 2010, the members of the Board of Management were
granted 276,000 stock options (2009: 259,200; 2008: 259,218) and
69,000 restricted share rights (2009: 69,132; 2008: 86,406).
At December 31, 2010, the members of the Board of Management held
1,957,282 stock options (2009: 2,064,872; 2008: 1,805,672) at a
weighted average exercise price of EUR 24.94 (2009: EUR 25.47; 2008:
EUR 27.31).