Philips 2010 Annual Report Download - page 99
Download and view the complete annual report
Please find page 99 of the 2010 Philips annual report below. You can navigate through the pages in the report by either clicking on the pages listed below, or by using the keyword search tool below to find specific information within the annual report.-
 1
1 -
2
-
3
-
4
-
5
-
6
-
7
-
8
-
9
-
10
-
11
-
12
-
13
-
14
-
15
-
16
-
17
-
18
-
19
-
20
-
21
-
22
-
23
-
24
-
25
-
26
-
27
-
28
-
29
-
30
-
31
-
32
-
33
-
34
-
35
-
36
-
37
-
38
-
39
-
40
-
41
-
42
-
43
-
44
-
45
-
46
-
47
-
48
-
49
-
50
-
51
-
52
-
53
-
54
-
55
-
56
-
57
-
58
-
59
-
60
-
61
-
62
-
63
-
64
-
65
-
66
-
67
-
68
-
69
-
70
-
71
-
72
-
73
-
74
-
75
-
76
-
77
-
78
-
79
-
80
-
81
-
82
-
83
-
84
-
85
-
86
-
87
-
88
-
 89
89 -
 90
90 -
 91
91 -
 92
92 -
 93
93 -
 94
94 -
 95
95 -
 96
96 -
 97
97 -
 98
98 -
 99
99 -
 100
100 -
 101
101 -
 102
102 -
 103
103 -
 104
104 -
 105
105 -
 106
106 -
 107
107 -
 108
108 -
 109
109 -
110
-
111
-
112
-
113
-
114
-
115
-
116
-
117
-
118
-
119
-
120
-
121
-
122
-
123
-
124
-
125
-
126
-
127
-
128
-
129
-
130
-
131
-
132
-
133
-
134
-
135
-
136
-
137
-
138
-
139
-
140
-
141
-
142
-
143
-
144
-
145
-
146
-
147
-
148
-
149
-
150
-
151
-
152
-
153
-
154
-
155
-
156
-
157
-
158
-
159
-
160
-
161
-
162
-
163
-
164
-
165
-
166
-
167
-
168
-
169
-
170
-
171
-
172
-
173
-
174
-
175
-
176
-
177
-
178
-
179
-
180
-
181
-
182
-
183
-
184
-
185
-
186
-
187
-
188
-
189
-
190
-
191
-
192
-
193
-
194
-
195
-
196
-
197
-
198
-
199
-
200
-
201
-
202
-
203
-
204
-
205
-
206
-
207
-
208
-
209
-
210
-
211
-
212
-
213
-
214
-
215
-
216
-
217
-
218
-
219
-
220
-
221
-
222
-
223
-
224
-
225
-
226
-
227
-
228
-
229
-
230
-
231
-
232
-
233
-
234
-
235
-
236
-
237
-
238
-
239
-
240
-
241
-
242
-
243
-
244
-
245
-
246
-
247
-
248
-
249
-
250
 |
 |

6 Sector performance 6.3.5 - 6.3.6
Annual Report 2010 99
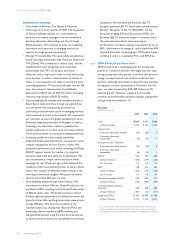
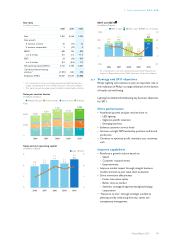
Key data
in millions of euros
2008 2009 2010
Sales 7,362 6,546 7,552
Sales growth
% increase, nominal 16 (11) 15
% increase, comparable1) 3 (13) 9
EBITA1) 480 145 869
as a % of sales 6.5 2.2 11.5
EBIT1) 24 (16) 695
as a % of sales 0.3 (0.2) 9.2
Net operating capital (NOC)1) 5,712 5,104 5,561
Cash flows before financing
activities1,2) (1,181) 624 590
Employees (FTEs) 57,367 51,653 53,888
1) For a reconciliation to the most directly comparable GAAP measures, see
chapter 16, Reconciliation of non-GAAP information, of this Annual Report
2) Prior period amounts have been revised to reflect an adjusted sector allocation
Sales per market cluster
in millions of euros
■-Western Europe--■-North America--■-other mature--■-emerging
9,000
6,000
3,000
0
2006
2,096
1,274
347
1,943
5,660
2007
2,524
1,219
308
2,270
6,321
2008
2,665
2,041
276
2,380
7,362
2009
2,271
1,811
253
2,211
6,546
2010
2,297
1,989
367
2,899
7,552
Sales and net operating capital
in billions of euros ■-Sales----NOC
9
6
3
0
9
6
3
0
2.8
5.7
2006
4.1
6.3
2007
5.7
7.4
2008
5.1
6.5
2009
5.6
7.6
2010
EBIT and EBITA1)
in millions of euros
■-EBIT in value--■
■-EBITA in value----EBITA as a % of sales
1,200
800
400
0
(400)
30
20
10
0
(10)
564 71
635
11.6
2006
66474
738
11.7
2007
24
456
480
6.5
2008
(16)
161
145
2.2
2009
695
174
869
11.5
2010
161
1) For a reconciliation to the most directly comparable GAAP measures, see
chapter 16, Reconciliation of non-GAAP information, of this Annual Report
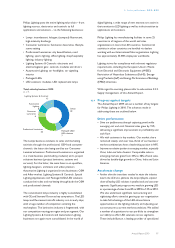
6.3.6 Strategy and 2011 objectives
Philips Lighting will continue to play an important role in
the realization of Philips’ strategic ambitions in the domain
of health and well-being.
Lighting has defined the following key business objectives
for 2011:
Drive performance
• Accelerate growth and gain market share in:
- LED lighting
- Segment-specific solutions
- Emerging markets
• Enhance customer service levels
• Increase outright NPS leadership positions and brand
preference
• Continue to optimize profit, minimize cost, maximize
cash
Improve capabilities
• Reinforce a growth culture based on:
- Speed
- Customer responsiveness
- Empowerment
• Improve market impact through integral business
models and end-to-end value chain execution
• Drive innovation effectiveness
- Faster innovation cycles
- Better time-to-market
- Seamless strategy/design/marketing/technology
cooperation
• “Resource to win” through strategic workforce
planning and by enhancing diversity, talent and
competency management