Philips 2010 Annual Report Download - page 179
Download and view the complete annual report
Please find page 179 of the 2010 Philips annual report below. You can navigate through the pages in the report by either clicking on the pages listed below, or by using the keyword search tool below to find specific information within the annual report.-
 1
1 -
2
-
3
-
4
-
5
-
6
-
7
-
8
-
9
-
10
-
11
-
12
-
13
-
14
-
15
-
16
-
17
-
18
-
19
-
20
-
21
-
22
-
23
-
24
-
25
-
26
-
27
-
28
-
29
-
30
-
31
-
32
-
33
-
34
-
35
-
36
-
37
-
38
-
39
-
40
-
41
-
42
-
43
-
44
-
45
-
46
-
47
-
48
-
49
-
50
-
51
-
52
-
53
-
54
-
55
-
56
-
57
-
58
-
59
-
60
-
61
-
62
-
63
-
64
-
65
-
66
-
67
-
68
-
69
-
70
-
71
-
72
-
73
-
74
-
75
-
76
-
77
-
78
-
79
-
80
-
81
-
82
-
83
-
84
-
85
-
86
-
87
-
88
-
89
-
90
-
91
-
92
-
93
-
94
-
95
-
96
-
97
-
98
-
99
-
100
-
101
-
102
-
103
-
104
-
105
-
106
-
107
-
108
-
109
-
110
-
111
-
112
-
113
-
114
-
115
-
116
-
117
-
118
-
119
-
120
-
121
-
122
-
123
-
124
-
125
-
126
-
127
-
128
-
129
-
130
-
131
-
132
-
133
-
134
-
135
-
136
-
137
-
138
-
139
-
140
-
141
-
142
-
143
-
144
-
145
-
146
-
147
-
148
-
149
-
150
-
151
-
152
-
153
-
154
-
155
-
156
-
157
-
158
-
159
-
160
-
161
-
162
-
163
-
164
-
165
-
166
-
167
-
168
-
 169
169 -
 170
170 -
 171
171 -
 172
172 -
 173
173 -
 174
174 -
 175
175 -
 176
176 -
 177
177 -
 178
178 -
 179
179 -
 180
180 -
 181
181 -
 182
182 -
 183
183 -
 184
184 -
 185
185 -
 186
186 -
 187
187 -
 188
188 -
 189
189 -
190
-
191
-
192
-
193
-
194
-
195
-
196
-
197
-
198
-
199
-
200
-
201
-
202
-
203
-
204
-
205
-
206
-
207
-
208
-
209
-
210
-
211
-
212
-
213
-
214
-
215
-
216
-
217
-
218
-
219
-
220
-
221
-
222
-
223
-
224
-
225
-
226
-
227
-
228
-
229
-
230
-
231
-
232
-
233
-
234
-
235
-
236
-
237
-
238
-
239
-
240
-
241
-
242
-
243
-
244
-
245
-
246
-
247
-
248
-
249
-
250
 |
 |

13 Group financial statements 13.11 - 13.11 20 21 22
Annual Report 2010 179
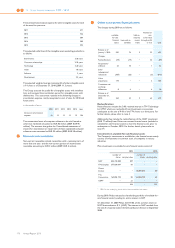
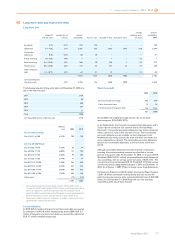
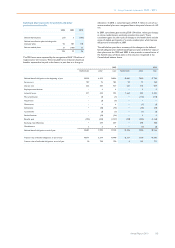
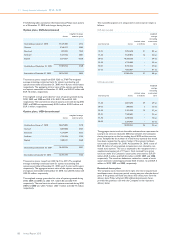
The movements in the provisions and liabilities for restructuring in 2009
are presented by sector as follows:
Dec. 31,
2008 addi-
tions utilized released other
changes1)
Dec. 31,
2009
Healthcare 58 37 (61) (11) 1 24
Consumer
Lifestyle 137 134 (109) (23) 3 142
Lighting 135 186 (116) (41) − 164
GM&S 42 68 (37) (6) (1) 66
372 425 (323) (81) 3 396
1) Other changes primarily relate to translation differences
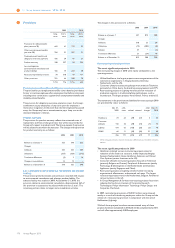
The most significant projects in 2008
• Healthcare’s restructuring projects were undertaken to reduce
operating costs and simplify the organization. The projects affected
many locations, most notably sites in Hamburg (Germany), Helsinki
(Finland) and Andover (US).
• Consumer Lifestyle’s main projects primarily relate to the
integration of the former DAP and CE businesses, the exit of TV in
North America, the restructuring and subsequent sale of the
Television factory in Juarez (Mexico) and the optimization of the
European supply footprint within almost all businesses.
• In Lighting, over 60 restructuring projects were active during 2008
and a total amount of EUR 156 million was added to the provision
and liability for restructuring. A significant portion of the charge
related to actions taken to address the ongoing shift from
incandescent bulbs to energy-efficient lighting solutions. Other main
projects within the Lighting sector included the closure of lamp
phosphor production in Maarheeze (the Netherlands), the
consolidation of production activities from Fairmont to Salina (US),
the reorganization of the wire & lead coiling activities in Turnhout
(Belgium) and Maarheeze (the Netherlands), the reorganization of
R&D activities within traditional lighting, mainly in Turnhout
(Belgium) and Roosendaal (the Netherlands), and the reorganization
and staff reductions of the headquarters in Eindhoven (the
Netherlands). Other smaller projects in Lighting, in various
locations, were aimed at further increasing organizational
effectiveness and reducing the fixed cost base.
• Within Group Management & Services, most of the costs relate to
the move of the US country organization headquarters from New
York to Andover, initiated in 2007, and the restructuring of
Assembleon.
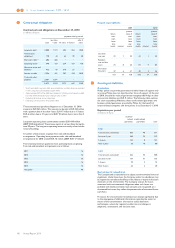
The movements in the provisions and liabilities for restructuring in 2008
are presented by sector as follows:
Dec. 31,
2007 addi-
tions utilized released other
changes Dec. 31,
2008
Healthcare − 62 (2) − (2) 58
Consumer
Lifestyle 10 174 (48) − 1 137
Lighting 14 156 (34) (2) 1 135
GM&S 20 35 (12) − (1) 42
44 427 (96) (2) (1) 372
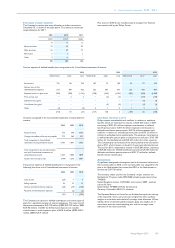
Other provisions
Other provisions include provisions for employee jubilee funds totaling
EUR 80 million (2009: EUR 77 million), self-insurance liabilities of
EUR 64 million (2009: EUR 65 million), liabilities related to business
combinations totaling EUR 24 million (2009: EUR 46 million) and
provisions for expected losses on existing projects/orders of EUR 7
million (2009: EUR 10 million). The Group expects to utilize the
liabilities related to business combinations and self-insurance liabilities
mainly within the next three years, and the provision for expected
losses on existing projects/orders mainly within the next year. The
provisions for employee jubilee funds and all other provisions are
expected to be mainly utilized within the next five years.
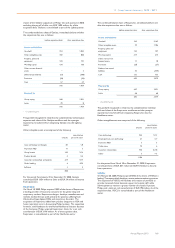
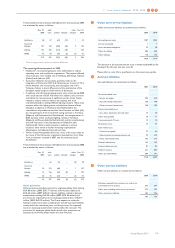
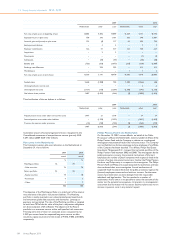
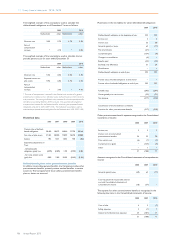
20 Other non-current liabilities
Other non-current liabilities are summarized as follows:
2009 2010
Accrued pension costs 1,307 1,044
Income tax payable 1 1
Asset retirement obligations 25 28
Other tax liability 486 483
Other liabilities 110 158
1,929 1,714
The decrease in the accrued pension costs is mainly attributable to the
funding of the UK plan. See also note 28.
Please refer to note 3 for a specification on the income tax payable.
21 Accrued liabilities
Accrued liabilities are summarized as follows:
2009 2010
Personnel-related costs:
- Salaries and wages 392 474
- Accrued holiday entitlements 168 184
- Other personnel-related costs 190 183
Fixed-asset-related costs:
- Gas, water, electricity, rent and other 55 70
Other taxes payable 10 11
Communication & IT costs 13 10
Distribution costs 73 91
Sales-related costs:
- Commission payable 52 56
- Advertising and marketing-related costs 92 139
- Other sales-related costs 183 145
Material-related costs 165 197
Interest-related accruals 87 87
Deferred income 651 807
Other accrued liabilities 609 541
2,740 2,995
22 Other current liabilities
Other current liabilities are summarized as follows:
2009 2010
Advances received from customers on orders not
covered by work in process 243 291
Other taxes including social security premiums 275 227
Other short-term liabilities 185 236
703 754