Philips 2010 Annual Report Download - page 93
Download and view the complete annual report
Please find page 93 of the 2010 Philips annual report below. You can navigate through the pages in the report by either clicking on the pages listed below, or by using the keyword search tool below to find specific information within the annual report.-
 1
1 -
2
-
3
-
4
-
5
-
6
-
7
-
8
-
9
-
10
-
11
-
12
-
13
-
14
-
15
-
16
-
17
-
18
-
19
-
20
-
21
-
22
-
23
-
24
-
25
-
26
-
27
-
28
-
29
-
30
-
31
-
32
-
33
-
34
-
35
-
36
-
37
-
38
-
39
-
40
-
41
-
42
-
43
-
44
-
45
-
46
-
47
-
48
-
49
-
50
-
51
-
52
-
53
-
54
-
55
-
56
-
57
-
58
-
59
-
60
-
61
-
62
-
63
-
64
-
65
-
66
-
67
-
68
-
69
-
70
-
71
-
72
-
73
-
74
-
75
-
76
-
77
-
78
-
79
-
80
-
81
-
82
-
 83
83 -
 84
84 -
 85
85 -
 86
86 -
 87
87 -
 88
88 -
 89
89 -
 90
90 -
 91
91 -
 92
92 -
 93
93 -
 94
94 -
 95
95 -
 96
96 -
 97
97 -
 98
98 -
 99
99 -
 100
100 -
 101
101 -
 102
102 -
 103
103 -
104
-
105
-
106
-
107
-
108
-
109
-
110
-
111
-
112
-
113
-
114
-
115
-
116
-
117
-
118
-
119
-
120
-
121
-
122
-
123
-
124
-
125
-
126
-
127
-
128
-
129
-
130
-
131
-
132
-
133
-
134
-
135
-
136
-
137
-
138
-
139
-
140
-
141
-
142
-
143
-
144
-
145
-
146
-
147
-
148
-
149
-
150
-
151
-
152
-
153
-
154
-
155
-
156
-
157
-
158
-
159
-
160
-
161
-
162
-
163
-
164
-
165
-
166
-
167
-
168
-
169
-
170
-
171
-
172
-
173
-
174
-
175
-
176
-
177
-
178
-
179
-
180
-
181
-
182
-
183
-
184
-
185
-
186
-
187
-
188
-
189
-
190
-
191
-
192
-
193
-
194
-
195
-
196
-
197
-
198
-
199
-
200
-
201
-
202
-
203
-
204
-
205
-
206
-
207
-
208
-
209
-
210
-
211
-
212
-
213
-
214
-
215
-
216
-
217
-
218
-
219
-
220
-
221
-
222
-
223
-
224
-
225
-
226
-
227
-
228
-
229
-
230
-
231
-
232
-
233
-
234
-
235
-
236
-
237
-
238
-
239
-
240
-
241
-
242
-
243
-
244
-
245
-
246
-
247
-
248
-
249
-
250
 |
 |

6 Sector performance 6.2.5 - 6.2.5
Annual Report 2010 93
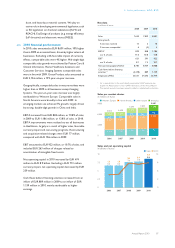
We achieved double-digit growth at Health & Wellness
and high single-digit growth at Personal Care, driven by
our increased investment in advertising and promotion.
Sales at Domestic Appliances showed low single-digit
growth, as strong growth in emerging markets, notably
China, was partly offset by lower sales in mature markets.
Comparable sales growth at Television was limited to 1%,
while sales declined at Audio & Video Multimedia and
Accessories.
From a geographical perspective, we recorded 6%
comparable sales growth in emerging markets, which was
partly offset by a 2% decline in mature markets, mainly in
Western Europe. Sales growth in emerging markets was
driven by solid growth in Latin America and Russia, though
this was tempered by a sales decline in China. The decline
in China was substantially due to a delay in the
implementation of the brand licensing agreement for
Television with TPV. Emerging markets’ share of sector
sales increased from 37% in 2009 to 41% in 2010. Green
Product sales amounted to over EUR 3 billion and
increased from 23% of total sales in 2009 to 34% in 2010.
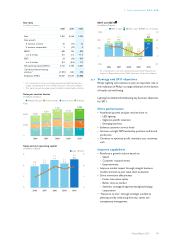
EBITA significantly improved from EUR 339 million, or
4.0% of sales, in 2009 to EUR 639 million, or 7.2% of sales,
in 2010. Restructuring and acquisition-related charges
amounted to EUR 61 million in 2010, compared to EUR
136 million in 2009. The year-on-year EBITA
improvement was largely driven by improved gross
margin, fixed cost savings, the previous year’s EUR 48
million product recall-related charges, and lower
restructuring charges. EBITA was higher than in 2009 in all
businesses, notably Domestic Appliances and Television.
EBIT amounted to EUR 595 million, or 6.7% of sales,
which included EUR 44 million of amortization charges,
mainly related to amortization of intangible fixed assets at
Health & Wellness and Domestic Appliances.
Net operating capital increased from EUR 625 million in
2009 to EUR 911 million in 2010, primarily due to higher
inventories at Television and an increase in assets
following the acquisition of Discus Holdings.
Cash flows before financing activities declined from an
inflow of EUR 598 million in 2009 to an inflow of EUR 404
million. The decline was mainly attributable to lower cash
inflow from changes in working capital, partly offset by
higher earnings.
Sales per market cluster
in millions of euros
■-Western Europe--■-North America--■-other mature--■-emerging
15,000
10,000
5,000
0
2006
5,308
2,939
298
4,369
12,914
2007
5,651
2,623
347
4,481
13,102
2008
4,631
1,741
287
4,230
10,889
20091)
3,987
1,084
216
3,180
8,467
2010
3,874
1,156
268
3,608
8,906
1) Revised to reflect an adjusted market cluster allocation.
Sales and net operating capital
in billions of euros ■-Sales----NOC
15
10
5
0
3.0
2.0
1.0
0
1.1
12.9
2006
1.1
13.1
2007
0.8
10.9
2008
0.6
8.5
2009
0.9
8.9
2010
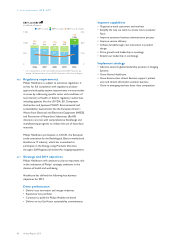
EBIT and EBITA1)
in millions of euros
■-EBIT in value--■
■-EBITA in value----EBITA as a % of sales
1,000
750
500
250
0
16.0
12.0
8.0
4.0
0
683 9
692
5.3
2006
78916
805
6.1
2007
110
16
126
1.2
2008
321
18
339
4.0
2009
59544
639
7.2
2010
16
16
1) For a reconciliation to the most directly comparable GAAP measures, see
chapter 16, Reconciliation of non-GAAP information, of this Annual Report