Philips 2010 Annual Report Download - page 73
Download and view the complete annual report
Please find page 73 of the 2010 Philips annual report below. You can navigate through the pages in the report by either clicking on the pages listed below, or by using the keyword search tool below to find specific information within the annual report.-
 1
1 -
2
-
3
-
4
-
5
-
6
-
7
-
8
-
9
-
10
-
11
-
12
-
13
-
14
-
15
-
16
-
17
-
18
-
19
-
20
-
21
-
22
-
23
-
24
-
25
-
26
-
27
-
28
-
29
-
30
-
31
-
32
-
33
-
34
-
35
-
36
-
37
-
38
-
39
-
40
-
41
-
42
-
43
-
44
-
45
-
46
-
47
-
48
-
49
-
50
-
51
-
52
-
53
-
54
-
55
-
56
-
57
-
58
-
59
-
60
-
61
-
62
-
 63
63 -
 64
64 -
 65
65 -
 66
66 -
 67
67 -
 68
68 -
 69
69 -
 70
70 -
 71
71 -
 72
72 -
 73
73 -
 74
74 -
 75
75 -
 76
76 -
 77
77 -
 78
78 -
 79
79 -
 80
80 -
 81
81 -
 82
82 -
 83
83 -
84
-
85
-
86
-
87
-
88
-
89
-
90
-
91
-
92
-
93
-
94
-
95
-
96
-
97
-
98
-
99
-
100
-
101
-
102
-
103
-
104
-
105
-
106
-
107
-
108
-
109
-
110
-
111
-
112
-
113
-
114
-
115
-
116
-
117
-
118
-
119
-
120
-
121
-
122
-
123
-
124
-
125
-
126
-
127
-
128
-
129
-
130
-
131
-
132
-
133
-
134
-
135
-
136
-
137
-
138
-
139
-
140
-
141
-
142
-
143
-
144
-
145
-
146
-
147
-
148
-
149
-
150
-
151
-
152
-
153
-
154
-
155
-
156
-
157
-
158
-
159
-
160
-
161
-
162
-
163
-
164
-
165
-
166
-
167
-
168
-
169
-
170
-
171
-
172
-
173
-
174
-
175
-
176
-
177
-
178
-
179
-
180
-
181
-
182
-
183
-
184
-
185
-
186
-
187
-
188
-
189
-
190
-
191
-
192
-
193
-
194
-
195
-
196
-
197
-
198
-
199
-
200
-
201
-
202
-
203
-
204
-
205
-
206
-
207
-
208
-
209
-
210
-
211
-
212
-
213
-
214
-
215
-
216
-
217
-
218
-
219
-
220
-
221
-
222
-
223
-
224
-
225
-
226
-
227
-
228
-
229
-
230
-
231
-
232
-
233
-
234
-
235
-
236
-
237
-
238
-
239
-
240
-
241
-
242
-
243
-
244
-
245
-
246
-
247
-
248
-
249
-
250
 |
 |

5 Group performance 5.3.2 - 5.3.3
Annual Report 2010 73
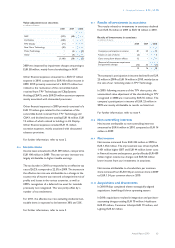
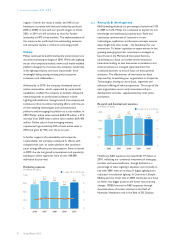
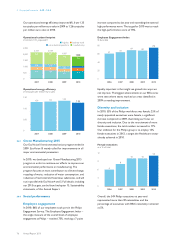
Research and development expenses per sector
in millions of euros
2008 2009 2010
Healthcare 672 679 698
Consumer Lifestyle 513 395 369
Lighting 345 351 355
GM&S 247 206 154
Philips Group 1,777 1,631 1,576
Our new product sales – products introduced within
2010 (for B2C products) or three years (for B2B
products) – increased from 48% of total sales in 2009 to
52% in 2010. Philips aims to maintain this ratio at around
50%, while at the same time focusing on the profitability of
new products and reallocating innovation spend more
towards new business creation.
5.3.3 Supply management
Executing Vision 2015 and strengthening our health and
well-being leadership requires enhancing our Supply
strategy and governance approach. Our vision is to create
a Customer Value Chain that enables better customer
solutions, boosts our NPS, and powers growth. Customer
Value Chain is a series of activities that collectively
provide greater value than their sum. A more integrated
Supply community will ensure that every part of the value
chain works seamlessly together to benefit our customers
and our company.
The Supply organization encompasses three focused
functions: Commercial and Service Supply Chain,
Operations, and Purchasing. Collectively, they comprise
approximately 58,000 Philips employees and are
responsible for sourcing, making and delivering products
and solutions.
Management of shortages and management
of commodity price increases
The recovery of the global economy led to tight supply of
especially semiconductor components in the course of
2010. The scarcity and increased commodity prices led to
upward price pressure. We have been able to delay price
increases and smoothened out volatility through
commodity hedging and negotiations with our component
suppliers. The raw material price trends have also further
accelerated the wide deployment of Value Engineering
throughout the company, in close cooperation between
Supply and R&D.
We achieved Bill of Material (BOM) savings of 4.9% and
Non Product Related (NPR) savings of 5.2%.
In order to minimize the impact on our customer service
levels and sales, a number of initiatives have been taken.
Actions have been taken to rapidly improve our forecast
reliability and sales and operational planning processes,
both short term and longer term, in order to reduce such
risks for the future. Additional investments were made in
the emerging markets to ensure optimal local presence of
the supply function.
Concentration and consolidation of supply
base
In line with our brand promise of “sense and simplicity”,
Philips Supply continued its focus on leveraging the supply
base by bringing more spend to fewer, selected suppliers.
In the area of BOM the number of suppliers has been
reduced by approximately 25%, whereas in the area of
NPR approximately 15% reduction has been realized.
Creating long term strategic partnerships with suppliers is
an important enabler of Philips’ growth ambitions. In 2010
the number of suppliers to cover 80% of spend has been
reduced by approximately 10% on BOM and by
approximately 25% on NPR. Standardization of payment
terms has helped us to create uniformity and positively
influence Days Payable Outstanding.
Supplier risk management
We are monitoring our top 400 suppliers on a constant
basis. Risks are measured and, if required, contingency
plans are prepared.
Innovation with the supply base
Philips is putting a lot of emphasis on Open Innovation
programs by increasingly using the innovative power of
our suppliers. In the Supplier Forum 2010 with our top
suppliers Open Innovation was one of the key themes.
Combining Philips innovation with the innovative
capabilities and capacities of the supply base is expected to
deliver acceleration of profitable growth.
Sustainability in the supply chain
Philips remains focused on improving working conditions
and environmental performance in its supply chain and
encourages its suppliers to have the same focus. For more
information, refer to sub-section 5.4.5, Supplier
performance, of this Annual Report.