Philips 2010 Annual Report Download - page 78
Download and view the complete annual report
Please find page 78 of the 2010 Philips annual report below. You can navigate through the pages in the report by either clicking on the pages listed below, or by using the keyword search tool below to find specific information within the annual report.-
 1
1 -
2
-
3
-
4
-
5
-
6
-
7
-
8
-
9
-
10
-
11
-
12
-
13
-
14
-
15
-
16
-
17
-
18
-
19
-
20
-
21
-
22
-
23
-
24
-
25
-
26
-
27
-
28
-
29
-
30
-
31
-
32
-
33
-
34
-
35
-
36
-
37
-
38
-
39
-
40
-
41
-
42
-
43
-
44
-
45
-
46
-
47
-
48
-
49
-
50
-
51
-
52
-
53
-
54
-
55
-
56
-
57
-
58
-
59
-
60
-
61
-
62
-
63
-
64
-
65
-
66
-
67
-
 68
68 -
 69
69 -
 70
70 -
 71
71 -
 72
72 -
 73
73 -
 74
74 -
 75
75 -
 76
76 -
 77
77 -
 78
78 -
 79
79 -
 80
80 -
 81
81 -
 82
82 -
 83
83 -
 84
84 -
 85
85 -
 86
86 -
 87
87 -
 88
88 -
89
-
90
-
91
-
92
-
93
-
94
-
95
-
96
-
97
-
98
-
99
-
100
-
101
-
102
-
103
-
104
-
105
-
106
-
107
-
108
-
109
-
110
-
111
-
112
-
113
-
114
-
115
-
116
-
117
-
118
-
119
-
120
-
121
-
122
-
123
-
124
-
125
-
126
-
127
-
128
-
129
-
130
-
131
-
132
-
133
-
134
-
135
-
136
-
137
-
138
-
139
-
140
-
141
-
142
-
143
-
144
-
145
-
146
-
147
-
148
-
149
-
150
-
151
-
152
-
153
-
154
-
155
-
156
-
157
-
158
-
159
-
160
-
161
-
162
-
163
-
164
-
165
-
166
-
167
-
168
-
169
-
170
-
171
-
172
-
173
-
174
-
175
-
176
-
177
-
178
-
179
-
180
-
181
-
182
-
183
-
184
-
185
-
186
-
187
-
188
-
189
-
190
-
191
-
192
-
193
-
194
-
195
-
196
-
197
-
198
-
199
-
200
-
201
-
202
-
203
-
204
-
205
-
206
-
207
-
208
-
209
-
210
-
211
-
212
-
213
-
214
-
215
-
216
-
217
-
218
-
219
-
220
-
221
-
222
-
223
-
224
-
225
-
226
-
227
-
228
-
229
-
230
-
231
-
232
-
233
-
234
-
235
-
236
-
237
-
238
-
239
-
240
-
241
-
242
-
243
-
244
-
245
-
246
-
247
-
248
-
249
-
250
 |
 |

5 Group performance 5.4.4 - 5.4.5
78 Annual Report 2010
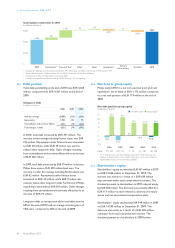
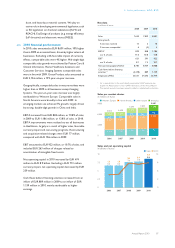
Lost Workday Injuries
per 100 FTEs
1.00
0.75
0.50
0.25
0
0.78
2006
0.81
2007
0.68
2008
0.44
2009
0.50
2010
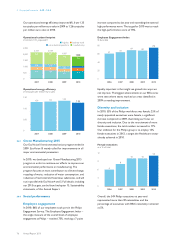
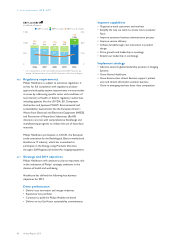
5.4.5 Supplier performance
The trend in outsourcing manufacturing activities
continued in 2010, in addition to the increased focus on
emerging countries. This implies an increased effort in
managing our impact on our supply chain, as this impact is
stronger in emerging countries, and will lead to an
increase of risk suppliers, requiring a related increase in
efforts in our supplier sustainability program.
Our suppliers
Philips remains focused on improving working conditions
and environmental performance in its supply chain and
encourages its suppliers to have the same focus.
Recognizing that this is a huge challenge requiring
industry-wide efforts, as well as active involvement of
other societal stakeholders, we continue to be active in
the Electronic Industry Citizenship Coalition (EICC). We
encourage our strategic and preferred suppliers to join
the EICC as well. We will continue to seek active
cooperation with other societal stakeholders either
directly or through institutions like the EICC or the multi-
stakeholder program from the Dutch Sustainable Trade
Initiative.
Supplier Sustainability Involvement
Program
The Philips Supplier Sustainability Involvement Program is
built on five pillars: setting out our requirements; getting
suppliers to understand these and commit themselves;
monitoring identified risk suppliers through audits;
working with suppliers to resolve issues; and engaging
stakeholders. For more details see section 15.6, Supplier
indicators, of this Annual Report.
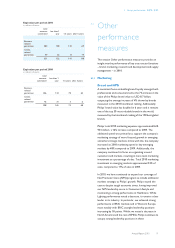
2010 supplier audits
Philips conducted 273 initial and continued conformance
audits in 2010. During these audits an external specialized
company visited the supplier sites in risk countries for a 2
to 4 man-days audit.
Distribution of supplier audits by country
Brazil
18
China
207
Indonesia
10
India
26
Mexico
7
Others
5
The most frequently observed areas of non-compliance
were:
•Working hours, wages and benefits: excessive
overtime, continual seven-day work weeks, record-
keeping of standard and overtime working hours,
payment of overtime premiums.
• Emergency preparedness: fire detection and
suppression systems, blocked emergency exits, fire
drills.
• Occupational safety: immediate threat to health and
safety.
• Industrial hygiene: appropriate controls for worker
exposures to chemical, biological and physical agents.
• Hazardous substances: improper disposal of hazardous
waste.
• Lack of adequate management systems to safeguard
compliance with the EICC code for labor and ethics,
health and safety, and environment.
Average non-compliances per audit
■-limited tolerance--■-zero tolerance
25
20
15
10
5
0
13
4
Brazil
13
4
China
7
1
Indonesia
15
3
India
17
6
Mexico
8
6
Philippines
3
2
Ukraine
10
Vietnam
13
4
Average
At the end of 2010 the identified zero-tolerance non-
compliances were either resolved or still within the
agreed deadline for resolution. For more details on audit
results, please refer to section 15.6, Supplier indicators, of
this Annual Report.