Philips 2010 Annual Report Download - page 59
Download and view the complete annual report
Please find page 59 of the 2010 Philips annual report below. You can navigate through the pages in the report by either clicking on the pages listed below, or by using the keyword search tool below to find specific information within the annual report.-
 1
1 -
2
-
3
-
4
-
5
-
6
-
7
-
8
-
9
-
10
-
11
-
12
-
13
-
14
-
15
-
16
-
17
-
18
-
19
-
20
-
21
-
22
-
23
-
24
-
25
-
26
-
27
-
28
-
29
-
30
-
31
-
32
-
33
-
34
-
35
-
36
-
37
-
38
-
39
-
40
-
41
-
42
-
43
-
44
-
45
-
46
-
47
-
48
-
 49
49 -
 50
50 -
 51
51 -
 52
52 -
 53
53 -
 54
54 -
 55
55 -
 56
56 -
 57
57 -
 58
58 -
 59
59 -
 60
60 -
 61
61 -
 62
62 -
 63
63 -
 64
64 -
 65
65 -
 66
66 -
 67
67 -
 68
68 -
 69
69 -
70
-
71
-
72
-
73
-
74
-
75
-
76
-
77
-
78
-
79
-
80
-
81
-
82
-
83
-
84
-
85
-
86
-
87
-
88
-
89
-
90
-
91
-
92
-
93
-
94
-
95
-
96
-
97
-
98
-
99
-
100
-
101
-
102
-
103
-
104
-
105
-
106
-
107
-
108
-
109
-
110
-
111
-
112
-
113
-
114
-
115
-
116
-
117
-
118
-
119
-
120
-
121
-
122
-
123
-
124
-
125
-
126
-
127
-
128
-
129
-
130
-
131
-
132
-
133
-
134
-
135
-
136
-
137
-
138
-
139
-
140
-
141
-
142
-
143
-
144
-
145
-
146
-
147
-
148
-
149
-
150
-
151
-
152
-
153
-
154
-
155
-
156
-
157
-
158
-
159
-
160
-
161
-
162
-
163
-
164
-
165
-
166
-
167
-
168
-
169
-
170
-
171
-
172
-
173
-
174
-
175
-
176
-
177
-
178
-
179
-
180
-
181
-
182
-
183
-
184
-
185
-
186
-
187
-
188
-
189
-
190
-
191
-
192
-
193
-
194
-
195
-
196
-
197
-
198
-
199
-
200
-
201
-
202
-
203
-
204
-
205
-
206
-
207
-
208
-
209
-
210
-
211
-
212
-
213
-
214
-
215
-
216
-
217
-
218
-
219
-
220
-
221
-
222
-
223
-
224
-
225
-
226
-
227
-
228
-
229
-
230
-
231
-
232
-
233
-
234
-
235
-
236
-
237
-
238
-
239
-
240
-
241
-
242
-
243
-
244
-
245
-
246
-
247
-
248
-
249
-
250
 |
 |

5 Group performance 5.1 - 5.1
Annual Report 2010 59
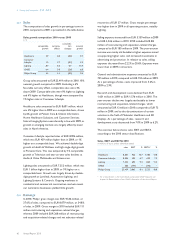
all businesses except Imaging Systems, which was
broadly in line with 2009. Growth at Consumer
Lifestyle was limited to 1%, as solid growth at Health &
Wellness and Personal Care was tempered by limited
growth at Television and sales declines at Audio &
Video Multimedia and Accessories.
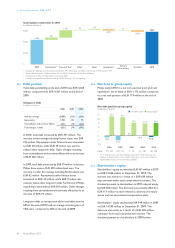
• 12% comparable sales growth was achieved in emerging
markets, while mature markets grew 1%. Emerging
markets accounted for 33% of total sales, up from 30%
in 2009.
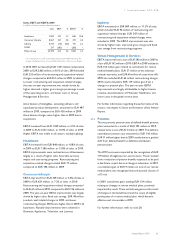
• We continued to invest in strategically aligned, high-
growth companies to strengthen our portfolio. In 2010,
we completed 11 acquisitions, contributing to all three
sectors, notably Discus Holdings in Consumer Lifestyle.
The cash outflow related to acquisitions amounted to
EUR 239 million.
• During the year, particularly in the first three quarters,
Television showed a significant year-on-year
improvement in EBITA. However, with high inventory
in retail, and severe price erosion in the fourth quarter,
the Television business did not achieve break-even for
the year. To improve profitability in the business and
reduce exposure, we concluded brand licensing
agreements in India and China. We will take further
action to address the profitability issue in the business
in 2011.
• We generated EUR 2.2 billion of cash flow from
operating activities, EUR 611 million higher than in
2009. Our cash flows before financing activities were
EUR 128 million higher than 2009, as higher cash flow
from operating activities was partly offset by lower
proceeds from the sale of stakes.
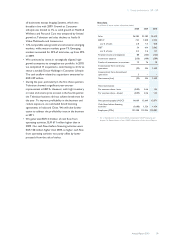
Key data
in millions of euros unless otherwise stated
2008 2009 2010
Sales 26,385 23,189 25,419
EBITA1) 744 1,050 2,552
as a % of sales 2.8 4.5 10.0
EBIT1) 54 614 2,065
as a % of sales 0.2 2.6 8.1
Financial income and expenses 88 (166) (122)
Income tax expense (256) (100) (509)
Results of investments in associates 19 76 18
Income (loss) from continuing
operations (95) 424 1,452
Income (loss) from discontinued
operations 3 − −
Net income (loss) (92) 424 1,452
Net income (loss):
Per common share - basic (0.09) 0.46 1.54
Per common share - diluted (0.09) 0.46 1.53
Net operating capital (NOC)1) 14,069 12,649 12,071
Cash flows before financing
activities1) (1,606) 1,326 1,454
Employees (FTEs) 121,398 115,924 119,001
1) For a reconciliation to the most directly comparable GAAP measures, see
chapter 16, Reconciliation of non-GAAP information, of this Annual Report