Philips 2010 Annual Report Download - page 74
Download and view the complete annual report
Please find page 74 of the 2010 Philips annual report below. You can navigate through the pages in the report by either clicking on the pages listed below, or by using the keyword search tool below to find specific information within the annual report.-
 1
1 -
2
-
3
-
4
-
5
-
6
-
7
-
8
-
9
-
10
-
11
-
12
-
13
-
14
-
15
-
16
-
17
-
18
-
19
-
20
-
21
-
22
-
23
-
24
-
25
-
26
-
27
-
28
-
29
-
30
-
31
-
32
-
33
-
34
-
35
-
36
-
37
-
38
-
39
-
40
-
41
-
42
-
43
-
44
-
45
-
46
-
47
-
48
-
49
-
50
-
51
-
52
-
53
-
54
-
55
-
56
-
57
-
58
-
59
-
60
-
61
-
62
-
63
-
 64
64 -
 65
65 -
 66
66 -
 67
67 -
 68
68 -
 69
69 -
 70
70 -
 71
71 -
 72
72 -
 73
73 -
 74
74 -
 75
75 -
 76
76 -
 77
77 -
 78
78 -
 79
79 -
 80
80 -
 81
81 -
 82
82 -
 83
83 -
 84
84 -
85
-
86
-
87
-
88
-
89
-
90
-
91
-
92
-
93
-
94
-
95
-
96
-
97
-
98
-
99
-
100
-
101
-
102
-
103
-
104
-
105
-
106
-
107
-
108
-
109
-
110
-
111
-
112
-
113
-
114
-
115
-
116
-
117
-
118
-
119
-
120
-
121
-
122
-
123
-
124
-
125
-
126
-
127
-
128
-
129
-
130
-
131
-
132
-
133
-
134
-
135
-
136
-
137
-
138
-
139
-
140
-
141
-
142
-
143
-
144
-
145
-
146
-
147
-
148
-
149
-
150
-
151
-
152
-
153
-
154
-
155
-
156
-
157
-
158
-
159
-
160
-
161
-
162
-
163
-
164
-
165
-
166
-
167
-
168
-
169
-
170
-
171
-
172
-
173
-
174
-
175
-
176
-
177
-
178
-
179
-
180
-
181
-
182
-
183
-
184
-
185
-
186
-
187
-
188
-
189
-
190
-
191
-
192
-
193
-
194
-
195
-
196
-
197
-
198
-
199
-
200
-
201
-
202
-
203
-
204
-
205
-
206
-
207
-
208
-
209
-
210
-
211
-
212
-
213
-
214
-
215
-
216
-
217
-
218
-
219
-
220
-
221
-
222
-
223
-
224
-
225
-
226
-
227
-
228
-
229
-
230
-
231
-
232
-
233
-
234
-
235
-
236
-
237
-
238
-
239
-
240
-
241
-
242
-
243
-
244
-
245
-
246
-
247
-
248
-
249
-
250
 |
 |

5 Group performance 5.4 - 5.4.2
74 Annual Report 2010
5.4 Sustainability
Management summary
Results in 2010
In 2010 we made good progress against our Sustainability
targets, focusing on:
•driving the implementation of our EcoVision programs,
• strengthening the Green Product and Green Innovation
approach at both Healthcare and Consumer Lifestyle,
leveraging the experience of our Lighting sector, and
• driving sustainability in the supply chain, including
suppliers of recent acquisitions, through our Supplier
Sustainability Involvement Program.
In the company’s Vision 2015, that was launched in 2010,
“Lead in Sustainability” has been identified as a strategic
objective, of which the implementation will be driven by
the EcoVision programs.
Results are summarized on the following pages and
detailed inchapter 15, Sustainability statements, of this
Annual Report.
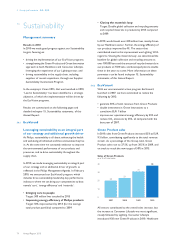
5.4.1 EcoVision5
Leveraging sustainability as an integral part
of our strategy and additional growth driver
At Philips, sustainability is all about enhancing the health
and well-being of individuals and the communities they live
in. At the same time we constantly endeavor to improve
the environmental performance of our products and
processes, and to drive sustainability throughout the
supply chain.
In 2010, we made leveraging sustainability an integral part
of our strategy and an additional driver of growth, as
reflected in the Philips Management Agenda. In February
2010, we announced our EcoVision5 program, which
includes three sustainability leadership key performance
indicators where we can bring our competencies to bear,
namely ‘care’, ‘energy efficiency’ and ‘materials’:
•Bringing care to people
Target: 500 million lives touched by 2015
•Improving energy efficiency of Philips products
Target: 50% improvement by 2015 (for the average
total product portfolio) compared to 2009
•Closing the materials loop
Target: Double global collection and recycling amounts
and recycled materials in products by 2015 compared
to 2009.
In 2010, we did touch over 420 million lives, mainly driven
by our Healthcare sector. Further, the energy efficiency of
our products improved by 4%. The sector that
contributed most to this improvement was Lighting. With
regard to ‘Closing the materials loop’, we determined the
baseline for global collection and recycling amounts at
over 100,000 tons and the amount of recycled materials in
our products at 7,500 tons, and developed plans to double
these in the years to come. More information on these
parameters can be found inchapter 15, Sustainability
statements, of this Annual Report.
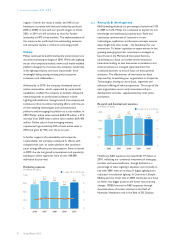
5.4.2 EcoVision4
With our environmental action program EcoVision4,
launched in 2007, we have committed to realize the
following by 2012:
• generate 30% of total revenues from Green Products
• double investment in Green Innovations to a
cumulative EUR 1 billion
• improve our operational energy efficiency by 25% and
reduce CO2 emissions by 25%, all compared with the
base year of 2007.
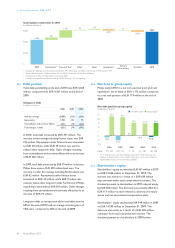
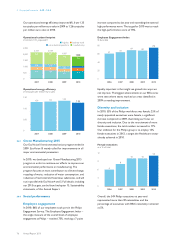
Green Product sales
In 2010, sales from Green Products increased 35% to EUR
9.5 billion, contributing significantly to the total revenue
stream. As a percentage of the Group total, Green
Product sales rose to 37.5%, up from 30.5% in 2009, and
on track to reach the new target of 50% in 2015.
Sales of Green Products
as a % of total sales
40
30
20
10
0
20
2007
23
2008
31
2009
38
2010
All sectors contributed to the overall sales increase, but
the increase at Consumer Lifestyle was most significant,
closely followed by Lighting. Consumer Lifestyle
introduced 150 new Green Products in 2010. Healthcare