Philips 2010 Annual Report Download - page 177
Download and view the complete annual report
Please find page 177 of the 2010 Philips annual report below. You can navigate through the pages in the report by either clicking on the pages listed below, or by using the keyword search tool below to find specific information within the annual report.-
 1
1 -
2
-
3
-
4
-
5
-
6
-
7
-
8
-
9
-
10
-
11
-
12
-
13
-
14
-
15
-
16
-
17
-
18
-
19
-
20
-
21
-
22
-
23
-
24
-
25
-
26
-
27
-
28
-
29
-
30
-
31
-
32
-
33
-
34
-
35
-
36
-
37
-
38
-
39
-
40
-
41
-
42
-
43
-
44
-
45
-
46
-
47
-
48
-
49
-
50
-
51
-
52
-
53
-
54
-
55
-
56
-
57
-
58
-
59
-
60
-
61
-
62
-
63
-
64
-
65
-
66
-
67
-
68
-
69
-
70
-
71
-
72
-
73
-
74
-
75
-
76
-
77
-
78
-
79
-
80
-
81
-
82
-
83
-
84
-
85
-
86
-
87
-
88
-
89
-
90
-
91
-
92
-
93
-
94
-
95
-
96
-
97
-
98
-
99
-
100
-
101
-
102
-
103
-
104
-
105
-
106
-
107
-
108
-
109
-
110
-
111
-
112
-
113
-
114
-
115
-
116
-
117
-
118
-
119
-
120
-
121
-
122
-
123
-
124
-
125
-
126
-
127
-
128
-
129
-
130
-
131
-
132
-
133
-
134
-
135
-
136
-
137
-
138
-
139
-
140
-
141
-
142
-
143
-
144
-
145
-
146
-
147
-
148
-
149
-
150
-
151
-
152
-
153
-
154
-
155
-
156
-
157
-
158
-
159
-
160
-
161
-
162
-
163
-
164
-
165
-
166
-
 167
167 -
 168
168 -
 169
169 -
 170
170 -
 171
171 -
 172
172 -
 173
173 -
 174
174 -
 175
175 -
 176
176 -
 177
177 -
 178
178 -
 179
179 -
 180
180 -
 181
181 -
 182
182 -
 183
183 -
 184
184 -
 185
185 -
 186
186 -
 187
187 -
188
-
189
-
190
-
191
-
192
-
193
-
194
-
195
-
196
-
197
-
198
-
199
-
200
-
201
-
202
-
203
-
204
-
205
-
206
-
207
-
208
-
209
-
210
-
211
-
212
-
213
-
214
-
215
-
216
-
217
-
218
-
219
-
220
-
221
-
222
-
223
-
224
-
225
-
226
-
227
-
228
-
229
-
230
-
231
-
232
-
233
-
234
-
235
-
236
-
237
-
238
-
239
-
240
-
241
-
242
-
243
-
244
-
245
-
246
-
247
-
248
-
249
-
250
 |
 |
13 Group financial statements 13.11 - 13.11 18
Annual Report 2010 177
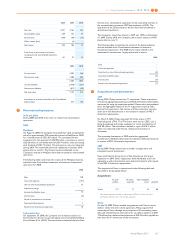
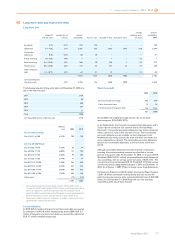
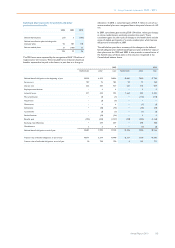
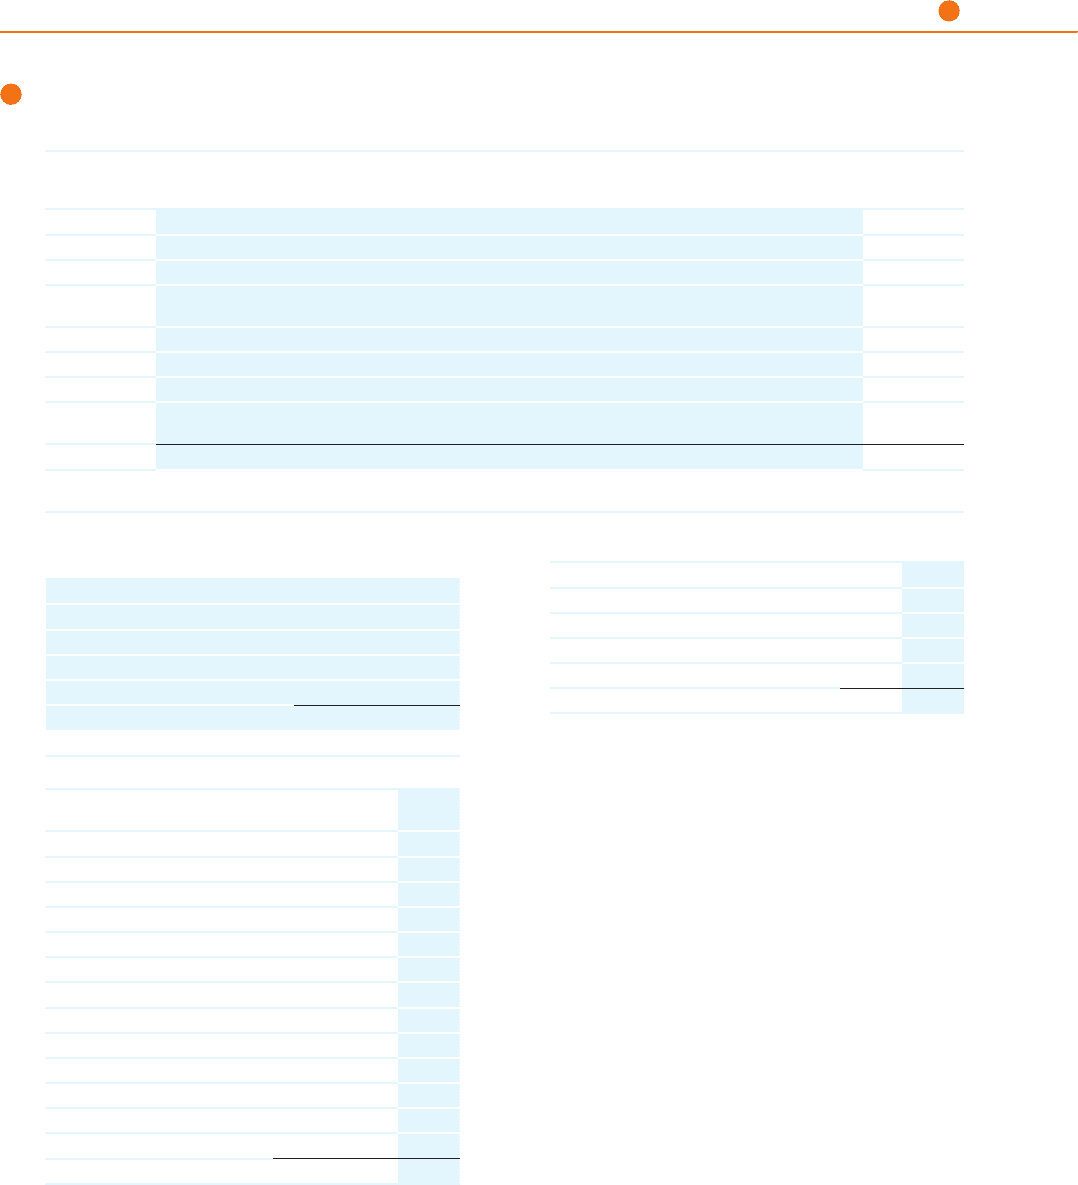
18 Long-term debt and short-term debt
Long-term debt
(range of)
interest rates average rate of
interest amount
outstanding due in 1 year due after 1 year due after 5 years
average
remaining term
(in years)
amount
outstanding
2009
Eurobonds 6.1% 6.1% 750 750 − − − 750
USD bonds 1.4 - 7.8% 5.7% 2,687 262 2,425 1,943 12.0 2,494
Convertible
debentures 0.3% 0.3% 38 38 − − − 51
Private financing 1.0 - 2.0% 1.0% 1 − 1 − 1.5 7
Bank borrowings 0.4 - 14.8% 3.1% 268 10 258 7 3.2 277
Finance leases 0.0 - 13.8% 2.3% 164 43 121 36 4.7 138
Other long-term
debt 1.3 - 18.1% 5.4% 64 51 13 − 2.3 69
3,972 1,154 2,818 1,986 3,786
Corresponding data
of previous year 5.5% 3,786 146 3,640 1,848 3,602
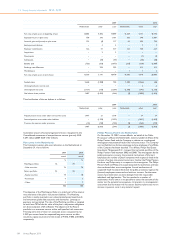
The following amounts of long-term debt as of December 31, 2010, are
due in the next five years:
2011 1,154
2012 46
2013 508
2014 267
2015 11
Total 1,986
Corresponding amount of previous year 1,710
effective
rate 2009 2010
Unsecured Eurobonds
Due 5/16/11; 6 1/8% 6.122% 750 750
Unsecured USD Bonds
Due 5/15/25; 7 3/4% 7.429% 69 74
Due 6/01/26; 7 1/5% 6.885% 115 124
Due 8/15/13; 7 1/4% 6.382% 99 107
Due 5/15/25; 7 1/8% 6.794% 71 77
Due 03/11/11; 3 3/8%1) 3.128% 243 262
Due 03/11/13; 4 5/8%1) 4.949% 347 374
Due 03/11/18; 5 3/4%1) 6.066% 868 935
Due 03/11/38; 6 7/8%1) 7.210% 694 748
Adjustments2) (12) (14)
2,494 2,687
1) The provisions applicable to these bonds, issued in March 2008, contain a
‘Change of Control Triggering Event’. If the Company would experience such an
event with respect to a series of corporate bonds, the Company may be
required to offer to purchase the bonds of the series at a purchase price equal to
101% of the principal amount, plus accrued and unpaid interest, if any.
2) Adjustments relate to issued bond discounts, transaction costs and fair value
adjustments for interest rate derivatives
Secured liabilities
In 2010, EUR 3.7 million of long-term and short-term debt was secured
by collateral of EUR 3.8 million manufacturing assets (2009: EUR 3.5
million of long-term and short-term debt was secured by collateral of
EUR 3.7 million manufacturing assets).
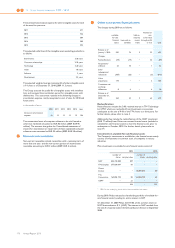
Short-term debt
2009 2010
Short-term bank borrowings 462 670
Other short-term loans 19 16
Current portion of long-term debt 146 1,154
627 1,840
During 2010, the weighted average interest rate on the bank
borrowings was 8.5% (2009: 8.1%).
In the Netherlands, the Company issued personnel debentures with a
5-year right of conversion into common shares of Royal Philips
Electronics. Convertible personnel debentures may not be converted
within a period of 3 years after the date of issue. These convertible
personnel debentures were available to most employees in the
Netherlands and were purchased by them with their own funds and
were redeemable on demand. The convertible personnel debentures
become non-convertible debentures at the end of the conversion
period.
Although convertible debentures have the character of long-term
financing, the total outstanding amounts are classified as current
portion of long-term debt. At December 31, 2010, an amount of EUR
38 million (2009: EUR 51 million) of convertible personnel debentures
was outstanding, with an average conversion price of EUR 21.15. The
conversion price varies between EUR 14.19 and EUR 31.59 with various
conversion periods ending between January 1, 2011 and December 31,
2013. As of January 1, 2009, Philips no longer issues these debentures.
Furthermore, Philips has a USD 2.5 billion Commercial Paper Program;
a EUR 1.8 billion committed revolving facility that can be used for
general corporate purpose, and a committed bilateral loan of EUR 200
million. As of December 31, 2010 Philips did not have any loans
outstanding under any of these facilities.